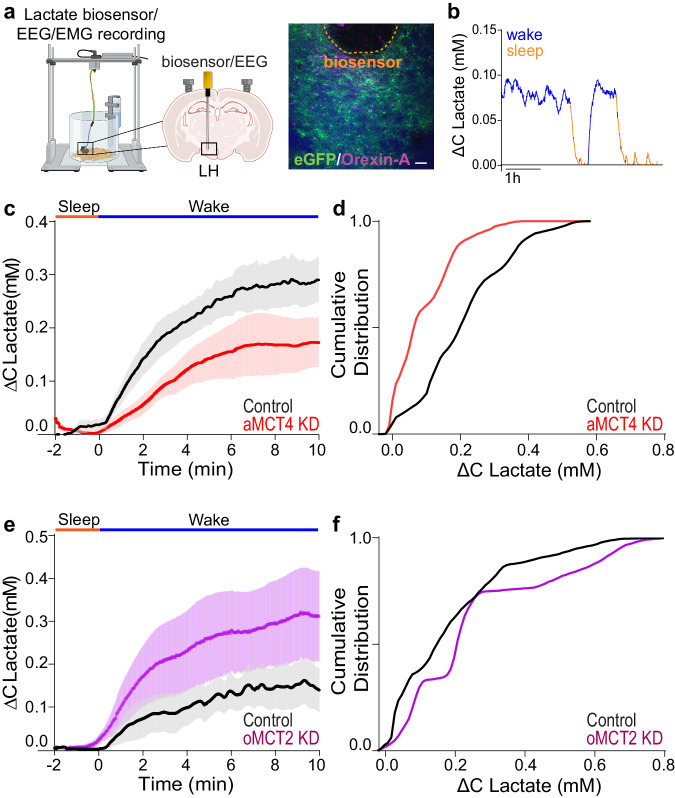
Fig. 5. Deletion of astrocytic MCT4 reduces extracellular lactate surges during wakefulness, while deletion of orexinergic neuron MCT2 increases extracellular lactate surges during wakefulness.
a Schematic representation of lactate biosensor recording/placement coupled with EEG/EMG, and immunofluorescence micrograph showing positioning of lactate biosensor (highlighted by orange line) in the LH near Orexin-A positive cells (magenta) and eGFP positive astrocytes in green. Scale bar = 100 µm. b Representative trace of extracellular lactate recording during the dark phase color coded according to EEG analysis. Mean stereotypical traces for control and aMCT4 KD mice (c), and oMCT2 KD mice (e) upon wakefulness (blue line “Wake”). Pooled data are shown as mean ± SEM. EEG=electroencephalogram; EMG=electromyography (d, f) cumulative frequency plots (Two-sample Kolmogorov−Smirnov test) of lactate concentrations during all wakefulness events in the first hours of the dark phase (ZT12-18). aMCT4 KD mice (red, n = 4) compared to controls mice (black, n = 5) (Kolmogorov−Smirnov test, p = 3.413510−57); (f) oMCT2 KD (violet, n = 6) mice compared to controls mice (black, n = 5) (Kolmogorov−Smirnov test, p = 1.88710−17). Source data are provided as a Source Data file.

