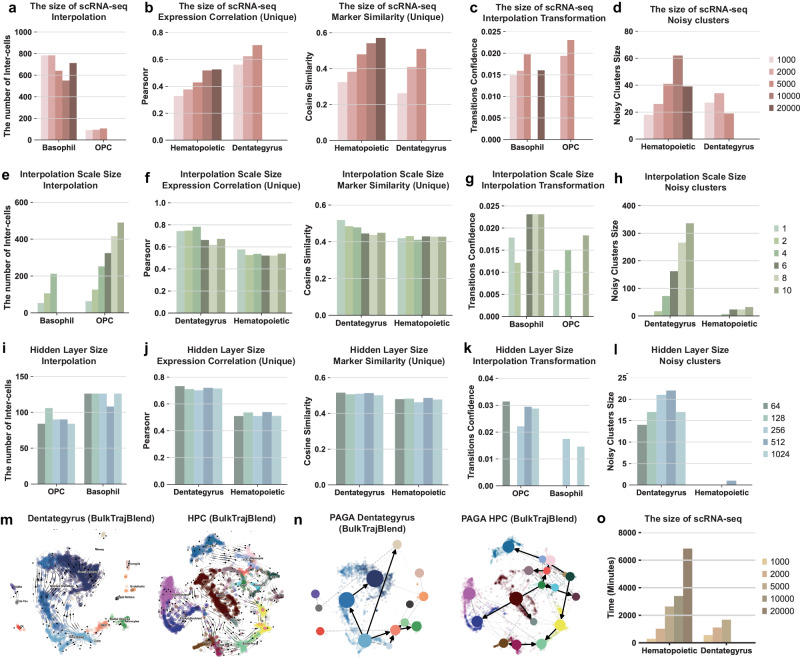
Fig. 2. The systematic hyperparameter testing for interpolation performance.
The tests examine varying sizes of raw single-cell profiles as input in a–d: (a) The quantity of “omitted” cells generated from Basophil cells in the Hematopoietic dataset and OPC cells in the Dentate Gyrus dataset, respectively. b The analysis juxtaposes two aspects: on the left panel, the expression trends’ correlation of marker genes between the reference and generated single-cell profiles; and on the right panel, the similarity between marker genes of the two profiles. c The transition probability of the generated target cells is computed along the cellular developmental trajectories, with Basophil cells in the Hematopoietic dataset and OPC cells in the Dentate Gyrus dataset. d The extent of noise clusters present in single-cell profiles, with the Hematopoietic dataset on the left and Dentate Gyrus on the right. e–h The scale sizes of the generated target cells utilized as input is scrutinized. i–l The sizes of neurons in the hidden layer vary as input. m The flow trend of cell developmental trajectories of neurogenic intermediate progenitor cells (nIPC) is visualized on UMAP plots for the Dentate Gyrus on the left and the Hematopoietic dataset on the right. n Cell-state transition directed graphs within the trajectory of Partition-based Graph Abstraction (PAGA) graphs are presented for the Dentate Gyrus on the left and Hematopoietic dataset on the right. o The model’s runtime in relation to different sizes of raw single-cell profile inputs is illustrated.

