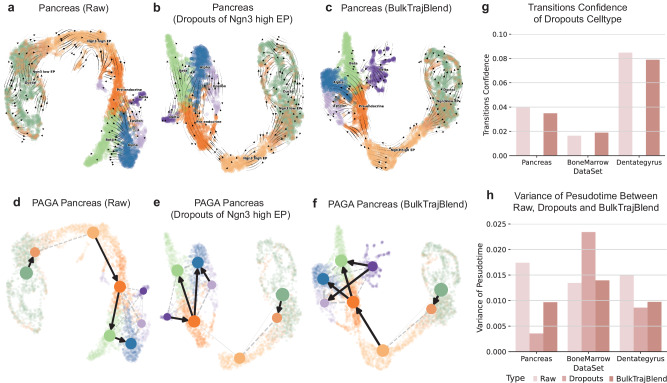
Fig. 3. Reconstruction of cell developmental trajectories in simulated “omission” within single-cell Profiles.
a–c Sequentially depicted are the raw pancreas dataset’s velocity stream, the effect of simulated omission via cell dropouts, and the refined dataset post-interpolation with BulkTrajBlend for dropout imputation as determined by pyVIA. The UMAP embedding is color-coded by cell type, consistent with the initial cluster annotations. Explained are the following cell types: Ngn3High EP, Ngn3High endocrine progenitor-precursor; Ngn3Low EP, Ngn3Low endocrine progenitor-precursor, Alpha, glucagon- producing α-cells; Beta, insulin-producing β-cells; Delta, somatostatin-producing δ-cells and Epsilon, ghrelin-producing ε-cells. d–f Displayed in sequence is the directed graph overlaid on the UMAP embeddings for the raw pancreas dataset, the dataset with “omission” in cell dropouts, and the dataset post-BulkTrajBlend interpolation based on pyVIA’s dropout assessments. g The confidence in cell state transitions as determined by pyVIA is presented for various datasets and experimental conditions. The corresponding color bars signify the methodology employed. Specifically, for the pancreas dataset with Ngn3High EP dropouts, the displayed confidence indicates the transition from Ngn3High EP to pre-endocrine cells. In the bone marrow dataset with HSC dropouts, the values represent the transition confidence from HSC to Monocytes. Likewise, the Dentate Gyrus dataset with dropouts of Granule Immature cells indicates the transition confidence from Granule immature to Granule mature cells. h The variance in pseudotime, as estimated by pyVIA, is documented across different datasets and experimental manipulations.

