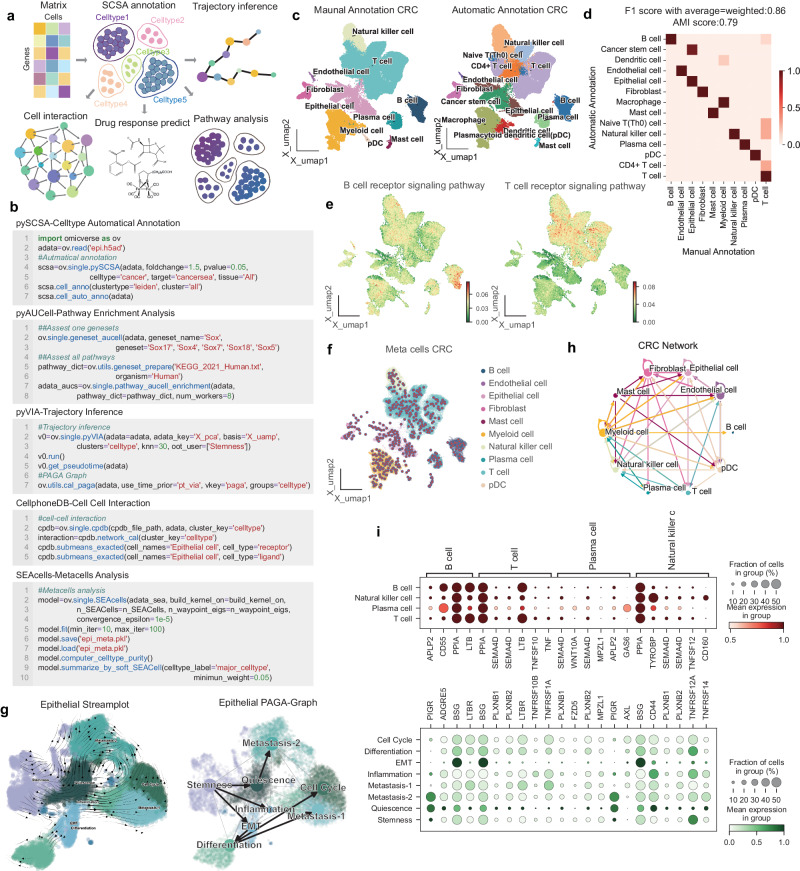
Fig. 5. OmicVerse a comprehensive analytical platform for single-cell RNA-seq analysis.
a A graphical overview highlights crucial analysis modules: cell type annotation (pySCSA), cellular interactions (CellPhoneDB), trajectory inference (pyVIA), pathway analysis (AUCell), and drug response prediction (scDrug). b An example code snippet illustrates the process for loading data and conducting analyses using pySCSA, CellPhoneDB, pyVIA, AUCell, and SEACells, with the inclusion of continuous covariates. c UMAP plot visualizes single-cell RNA sequencing (scRNA-seq) data from colorectal cancer (CRC) patients. The plot contrasts manual cell type annotations, shown in the left panel, with automatic annotations depicted in the right panel. d The concordance between manual and pySCSA-generated annotations is presented in a row-normalized confusion matrix. e Pathway enrichment within CRC cells is elucidated in a UMAP visualization, with the left side indicating B cell receptor signaling and the right side detailing T cell receptor signaling, as analyzed by AUCell. f Metacell composition within the CRC dataset is revealed in a UMAP plot. g Epithelial cell subpopulations in CRC are displayed in a UMAP plot; automated annotations by pySCSA are demonstrated on the left, complemented by a cell state transition directed graph derived from a Partition-based Graph Abstraction (PAGA) trajectory on the right. h CellPhoneDB computes an interaction network between CRC cell types, offering insights into intercellular communication. i Scaled mean expression levels of genes that code for interacting ligand-receptor proteins, identified by CellPhoneDB, are shown in dot plots to underscore the supporting interactions between immune and epithelial cells.

