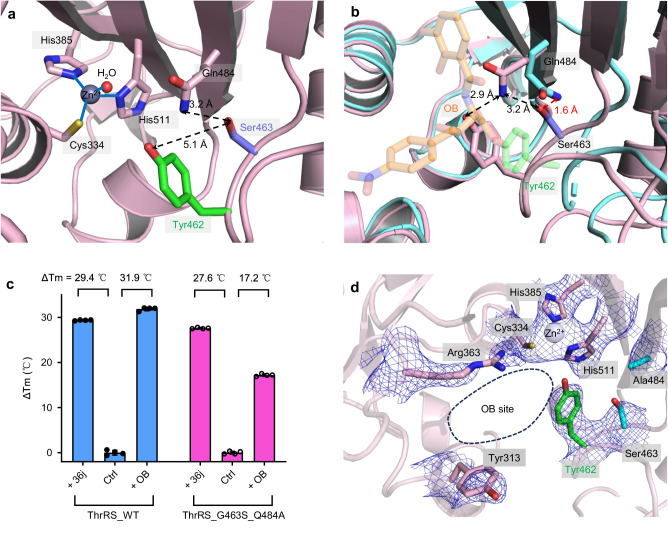
Fig. 3. Spatial interaction between Ser463 and Gln484 does not confer OB resistance.
a Zoomed-in view of the catalytic center of EcThrRS_G463S. Tyr462 is shown as green sticks, Ser463 is shown as slate sticks, and Gln484, Cys334, His385 and His511 are shown as pink sticks. b Superimposition of the structures of EcThrRS_G463S (pink cartoons) and EcThrRS_WT–OB (cyan cartoons). OB is shown as transparent orange sticks. c Diagram of the Tm values of EcThrRS_WT and EcThrRS_G463S_Q484A in the presence or absence of OB and 36j. Error bars represent the standard deviations (n = 4, mean value ± SD). All the data points are shown as small circles. d Zoomed-in view of the catalytic pocket of EcThrRS_G463S_Q484A which was crystallized in the presence of OB. The 2Fo-Fc electron map (blue meshes contoured at 0.8 σ) is shown together with the structure model. Tyr462 is shown as green sticks. Ser463 and Ala484 are shown as cyan sticks. The OB binding site is circled with black dashed lines. In this state, the OB cannot form a covalent bond with Tyr462; hence, no density for OB can be seen.

