Figure 2.
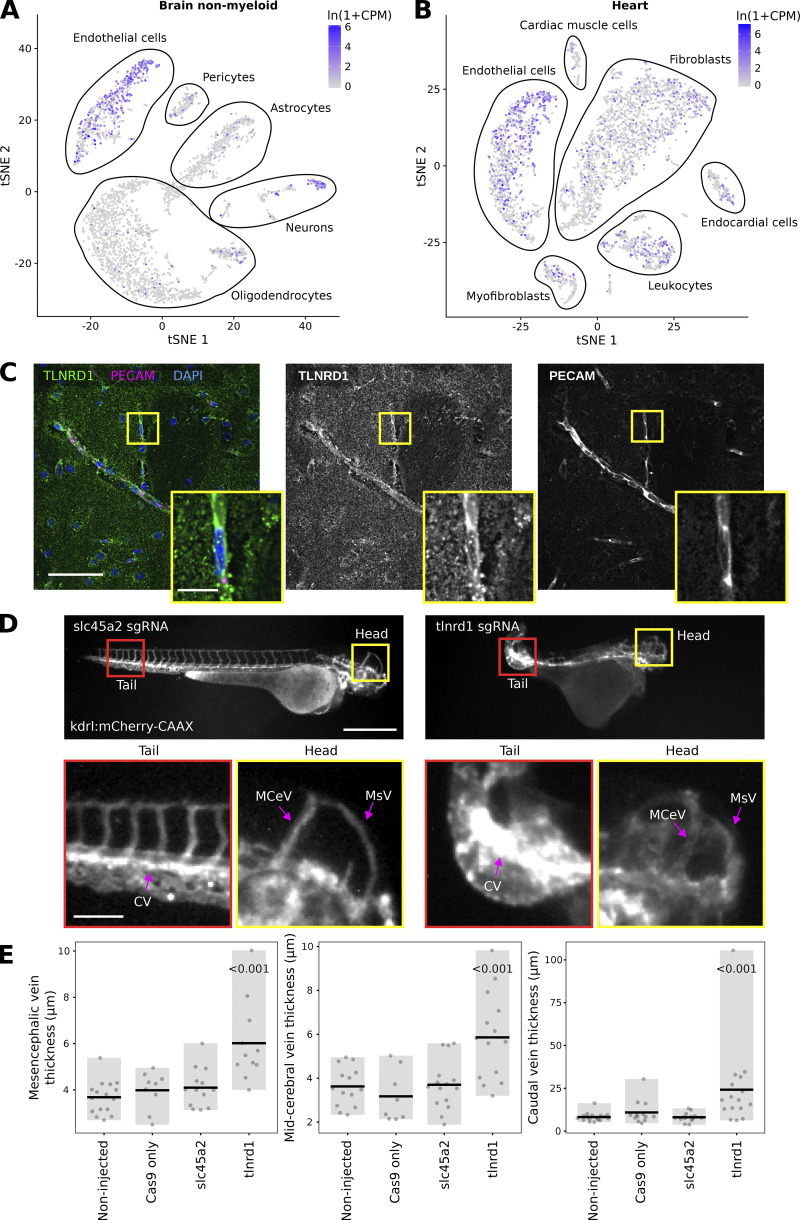
TLNRD1 is expressed in endothelial cells in vivo and regulates the vascular system. (A and B) TLNRD1 expression in mouse brain (A) and mouse heart (B). This single-cell RNA-Seq data is from the Tabula Muris dataset (Schaum et al., 2018). For the brain, endothelial cells were defined as Cdh5+, Pecam1+, Slco1c1+, and Ocln+; in the heart, endothelial cells were defined as Cdh5+ and Pecam1+ (Schaum et al., 2018). (C) Mouse brain slices were stained for TLNRD1, PECAM, and DAPI and imaged using a spinning disk confocal microscope. A single Z-plane is displayed. The yellow square highlights a magnified region of interest (ROI). Scale bars: (main) 50 µm and (inset) 10 µm. (D and E) kdrl:mCherry-CAAX zebrafish embryos were injected with recombinant Cas9 alone or together with sgRNA targeting TLNRD1 or slc45a2. The embryos were then imaged using a fluorescence microscope. (D) Representative images are displayed. The yellow and red squares highlight ROIs, which are magnified. The mesencephalic (MsV), mid-cerebral (MCeV), and caudal (CV) vein plexus are highlighted. Scale bars: (main) 500 µm and (inset) 100 µm. (E) The thickness of the mesencephalic, mid-cerebral, and caudal vein plexus measured from microscopy images are plotted as dot plots (non-injected, n = 17; Cas9, n = 13; slc45a2, n = 14; TLNRD1, n = 16). The gray bar highlights the data distribution, while the black line indicates the mean. The P values were determined using a randomization test.

