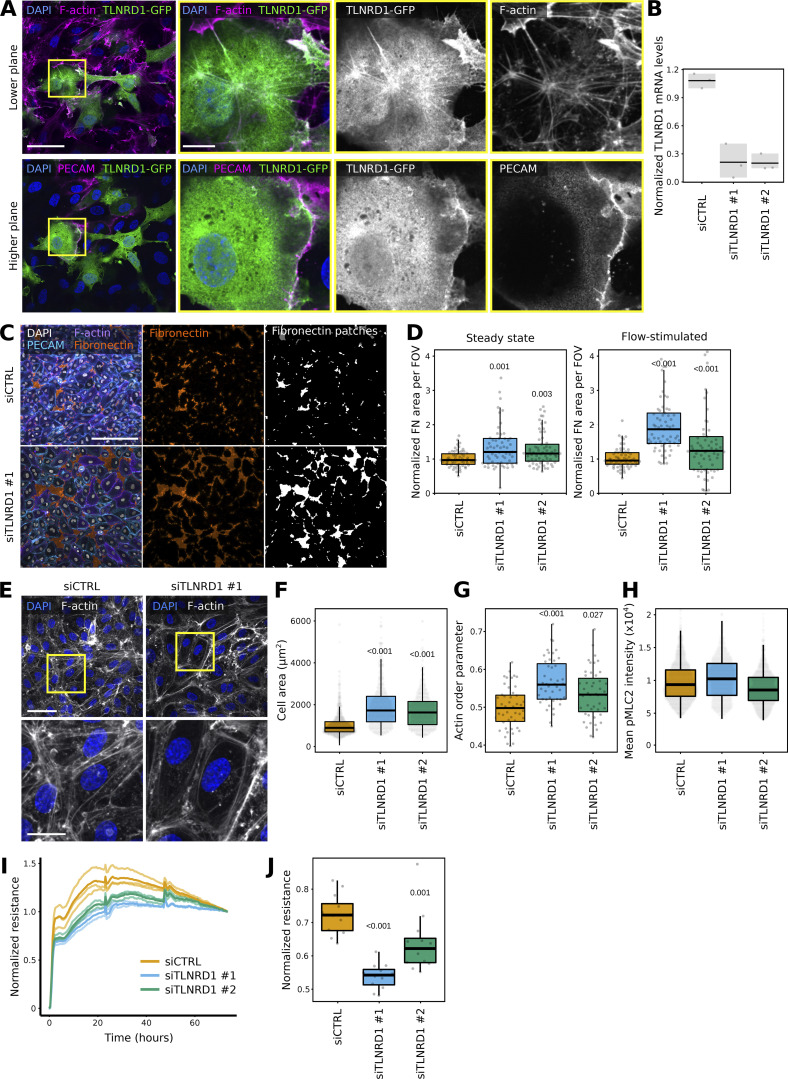
Figure 3.
TLNRD1 modulates endothelial monolayer integrity. (A) HUVECs expressing TLNRD1-GFP were fixed, stained for DAPI, F-actin, and PECAM, and imaged using a spinning disk confocal microscope. Two Z-planes from the same field of view are displayed. The yellow squares highlight magnified ROIs. Scale bars: (main) 50 µm and (inset) 10 µm. (B–D) TLNRD1 expression was silenced in HUVECs using two independent siRNA. (B) TLNRD1 expression levels were determined by qPCR. (C and D) HUVEC cells were allowed to form a monolayer in the presence or absence of flow stimulation. Cells were then fixed and stained for DAPI, F-actin, PECAM, and fibronectin (without permeabilization) before imaging on a spinning disk confocal microscope. (C) Representative maximum intensity projections are displayed (flow stimulation). Scale bar: 250 µm. (D) The area covered by fibronectin patches in each field of view was then quantified (three biological repeats, n > 60 fields of view per condition). (E–H) TLNRD1 expression was silenced in HUVECs using two independent siRNAs, and cells were allowed to form a monolayer without flow stimulation. Cells were then fixed and stained for DAPI and F-actin or phospho-Myosin light chain (pMLC S20). Images were acquired using a spinning disk confocal microscope. (E) Representative SUM projections are displayed. Scale bar: (main) 50 µm and (inset) 20 µm. (F) The cell area was measured using manual cell segmentation (three biological repeats, >45 fields of view, >460 cells per condition). (G) The actin organization (order parameter) was quantified using Alignment by Fourier Transform (Marcotti et al., 2021). (H) The average pMLC intensity per cell is displayed. In this case, cells were automatically segmented using cellpose (three biological repeats, n > 861 cells per condition). (I and J) Assessment of trans-endothelial electrical resistance (TEER) in siCTRL and siTLNRD1 endothelial monolayers was conducted utilizing the xCELLigence system. Individual TEER trajectories were normalized to their final readings to study the establishment of the TEER over time. (I) Displays represent data from one biological replicate. Here, the mean TEER trajectory from three individual wells is delineated with a bold line. In contrast, individual TEER curves are rendered in a lighter shade to delineate specific measurements within the same replicate. (J) Focuses on the comparative analysis at the time when siCTRL cells attain 70% of their ultimate TEER values, highlighting the impact of TLNRD1 silencing on developing endothelial barrier function (4 biological repeats, 11 measurements). The results are shown as Tukey boxplots. The whiskers (shown here as vertical lines) extend to data points no further from the box than 1.5× the interquartile range. The P values were determined using a randomization test.

