Figure 4.
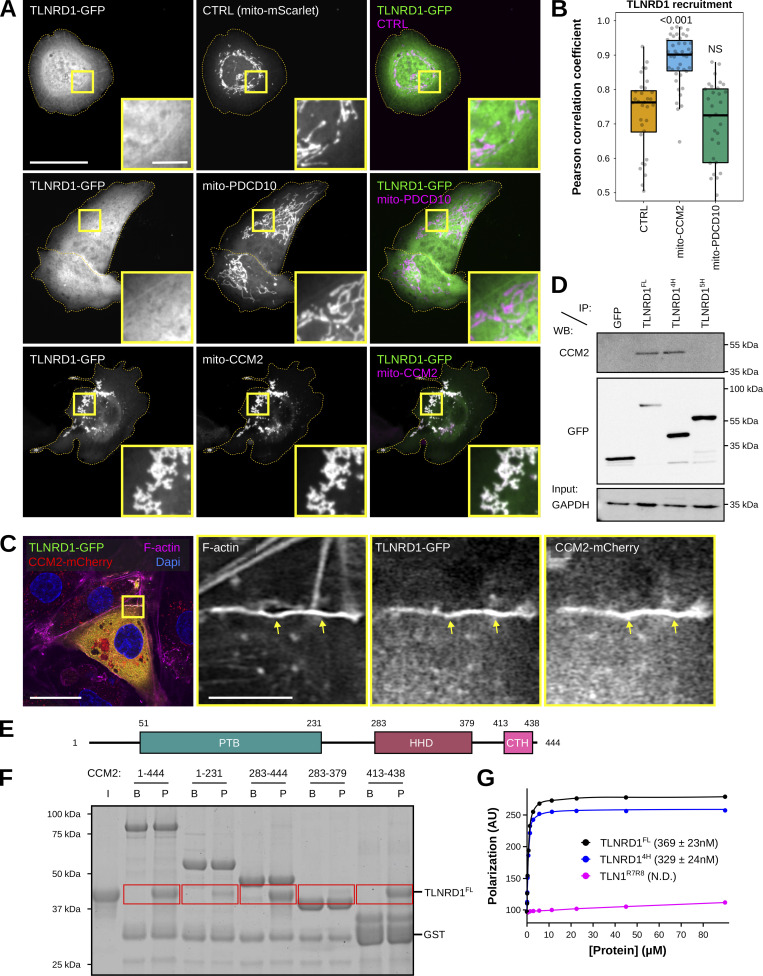
The TLNRD1–CCM2 interaction involves the TLNRD1 4-helix bundle and a C-terminal helix in CCM2. (A and B) U2OS cells expressing TLNRD1-GFP and mito-mScarlet (CTRL), mito-PDCD10-mScarlet, or mito-CCM2-mScarlet were imaged using a spinning disk confocal microscope. (A) Representative single Z-planes are displayed. Dashed yellow lines highlight the cell outlines. The yellow squares highlight magnified ROIs. Scale bars: (main) 25 µm and (inset) 5 µm. (B) 3D colocalization analysis was performed using the JACoP Fiji plugin (three biological repeats, n > 31 image stacks per condition). The results are shown as Tukey boxplots. The whiskers (shown here as vertical lines) extend to data points no further from the box than 1.5× the interquartile range. The P values were determined using a randomization test. NS indicates no statistical difference between the mean values of the highlighted condition and the control. (C) HUVECs expressing TLNRD1-GFP and CCM2-mCherry were stained for F-actin and DAPI and imaged using an Airyscan confocal microscope. A single Z-plane is displayed. The yellow squares highlight a magnified ROI. Scale bars: (main) 25 µm and (inset) 5 µm. (D) GFP-pulldown in HEK293T cells expressing GFP-TLNRD1, GFP-TLNRD14H. GFP-TLNRD15H or GFP alone. CCM2 recruitment to the bait proteins was assessed by western blotting (representative of three biological repeats). (E) CCM2 schematic showing the boundaries of the phosphotyrosine binding (PTB) domain, the harmonin homology domain (HHD), and the C-terminal helix (CTH). (F) A GST-pulldown assay was used where Glutathione agarose-bound GST-CCM2 fragments (beads: B) were incubated with recombinant TLNRD (input: I). After multiple washes, proteins bound to the beads (pellet: P) were eluted. Red boxes highlight areas of interest in the gel. (G) A fluorescence polarization assay was used to determine the Kd of the interaction between TLNRD1, TLNRD14H, or TLN1R7R8 with SUMO-CCM2CTH. Kd values (nM) are shown in parentheses. ND, not determined. Source data are available for this figure: SourceData F4.

