Figure 7.
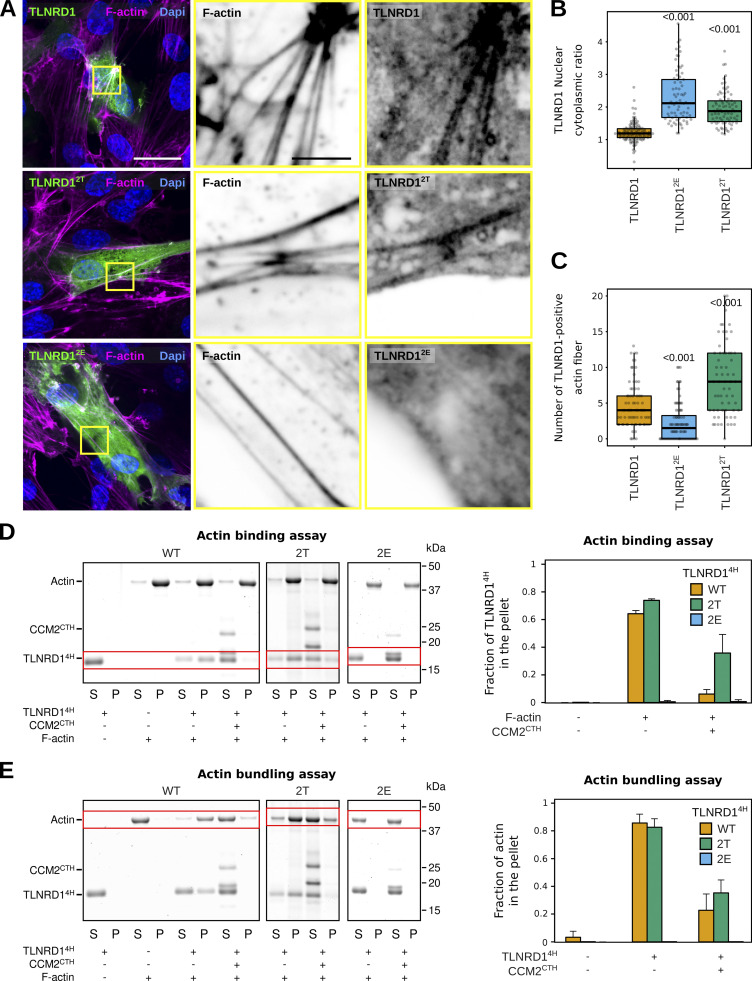
CCM2 modulates TLNRD1 localization and bundling activity. (A–C) HUVECs expressing various TLNRD1-GFP constructs were stained for DAPI and F-actin and imaged using a spinning disk confocal microscope. (A) Single Z-planes are displayed. The yellow squares highlight magnified ROIs. Scale bars: (main) 25 µm and (inset) 5 µm. (B and C) For each condition, the TLNRD1 nuclear-cytoplasmic ratio and the number of TLNRD1-positive actin fibers were quantified (see methods for details), and results are displayed as Tukey boxplots (three biological repeats, n > 72 cells per condition). The P values were determined using a randomization test. (D and E) Actin co-sedimentation assay with various TLNRD14H mutants in the presence or absence of CCM2CTH. Centrifugation at high (D, 48,000 rpm) or low (E, 16,000 rpm) speeds can distinguish between F-actin binding and bundling capability. Representative SDS-PAGE gels are displayed. The quantification was performed using densitometry, and the fraction of TLNRD1 (D) and F-actin (E) present in the pellet was plotted. Standard deviation from three independent repeats are represented as error bars. Source data are available for this figure: SourceData F7.

