Figure 8.
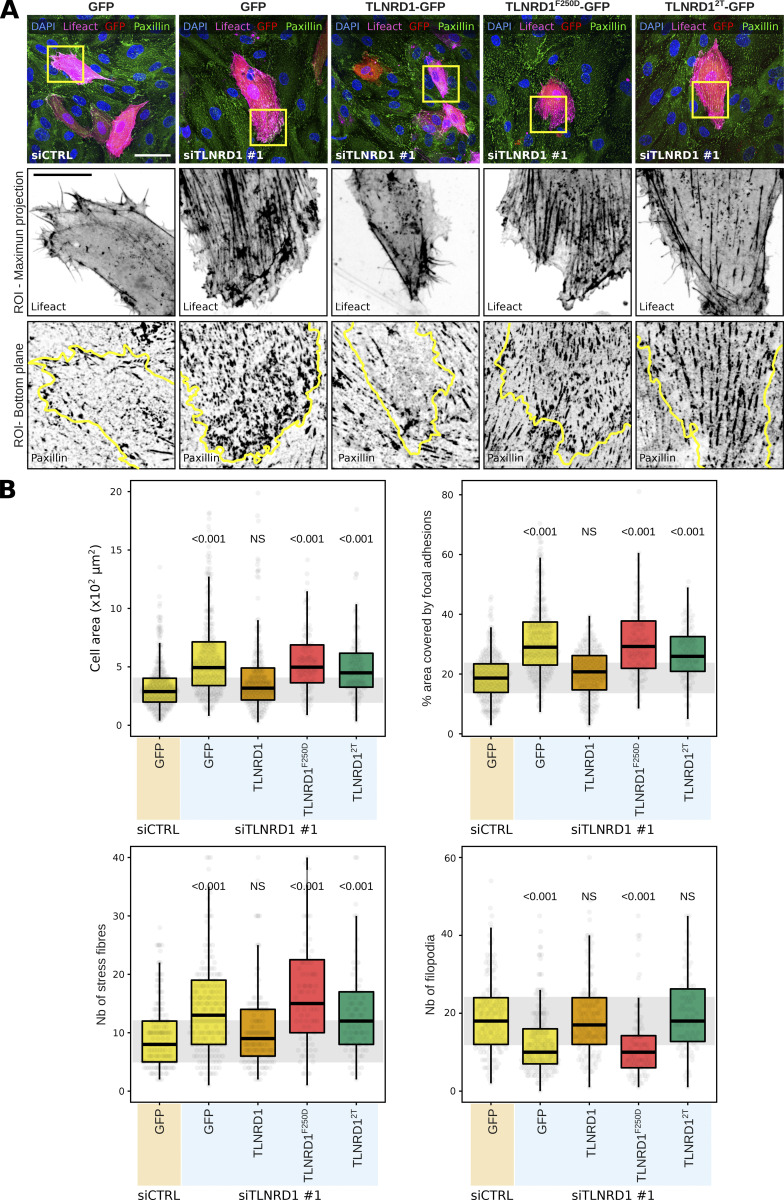
CCM2 modulates TLNRD1 localization and bundling activity. (A and B) HUVECs treated with siCTRL or siTLNRD1 siRNA and expressing lifeact-RFP along with GFP, TLNRD1-GFP, TLNRD12T-GFP, or TLNRD1F250D-GFP were fixed and stained for DAPI and paxillin, followed by imaging using a spinning disk confocal microscope. (A) Maximal intensity projections of representative fields of view. Highlighted within yellow squares are ROIs selected for magnification. The upper ROI panel presents maximal intensity projections showcasing lifeact-RFP and GFP-positive cells. In contrast, the lower ROI panels concentrate on the basal plane to showcase the paxillin-positive adhesions, with yellow outlines delineating the contours of GFP-positive cells. Scale bars: (main) 50 µm and (inset) 20 µm. (B) Quantitative analysis was performed on GFP-positive cells, evaluating various parameters: cell area, the proportion of the cell area covered by paxillin-positive adhesions, and the number of actin stress fibers and filopodia (four biological repeats, >60 fields of view per condition). The results are shown as Tukey boxplots. The whiskers (shown here as vertical lines) extend to data points no further from the box than 1.5× the interquartile range. The P values were determined using a randomization test.

