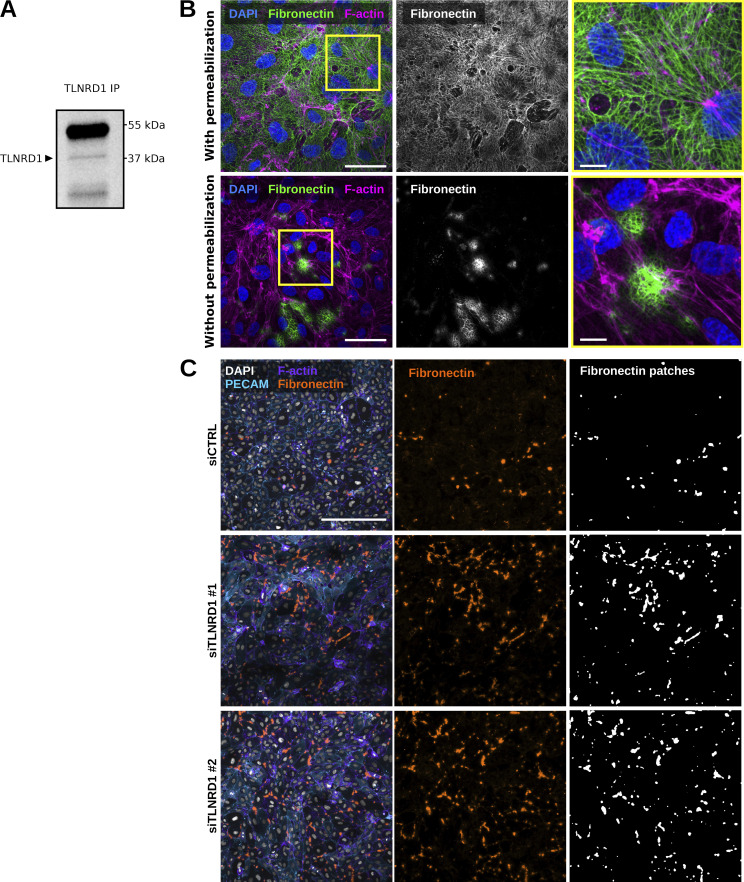
Figure S3.
TLNRD1 in endothelial cells. (A) TLNRD1 immunoprecipitation from HUVEC lysate. A representative Western blot is displayed. (B) HUVECs were allowed to form a monolayer. Cells were then fixed and stained for DAPI, F-actin, and fibronectin (with or without permeabilization) before being imaged on a spinning disk confocal microscope. Representative maximum intensity projections are displayed. Scale bar: 250 µm. (C) TLNRD1 expression was silenced in HUVECs using two independent siRNA. HUVECs were then allowed to form a monolayer without flow stimulation. Cells were then fixed and stained for DAPI, F-actin, PECAM, and Fibronectin (without permeabilization) before being imaged on a spinning disk confocal microscope. Representative maximum intensity projections are displayed. Scale bar: 250 µm. Source data are available for this figure: SourceData FS3.

