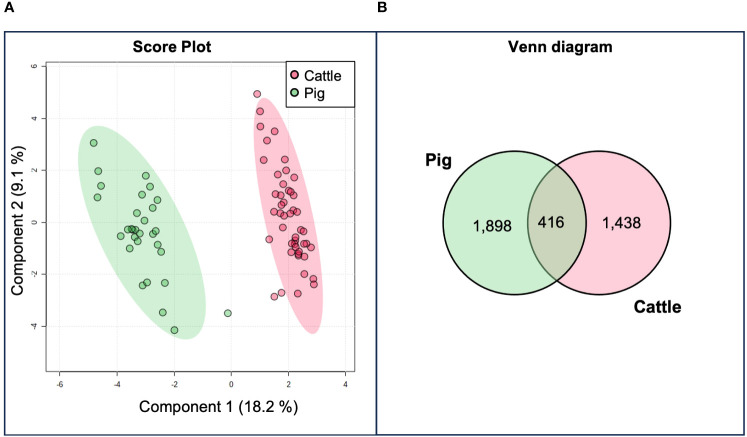
Figure 1.
(A) Sparse partial least squares discriminant analysis (sPLS-DA). Scattered red and green dots correspond to bovine and porcine granulomas, respectively, distributed according to their protein signature. A clear separation between bovine and pig granulomas is evident. The explained variances for each component are shown in brackets. (B) Venn diagram showing the distribution of m/z features present in cattle and pigs, obtained from matrix-assisted laser desorption/ionization mass spectrometry imaging (MALDI-MSI) analysis and identifying species-specific m/z as well as those common m/z features among both species.

