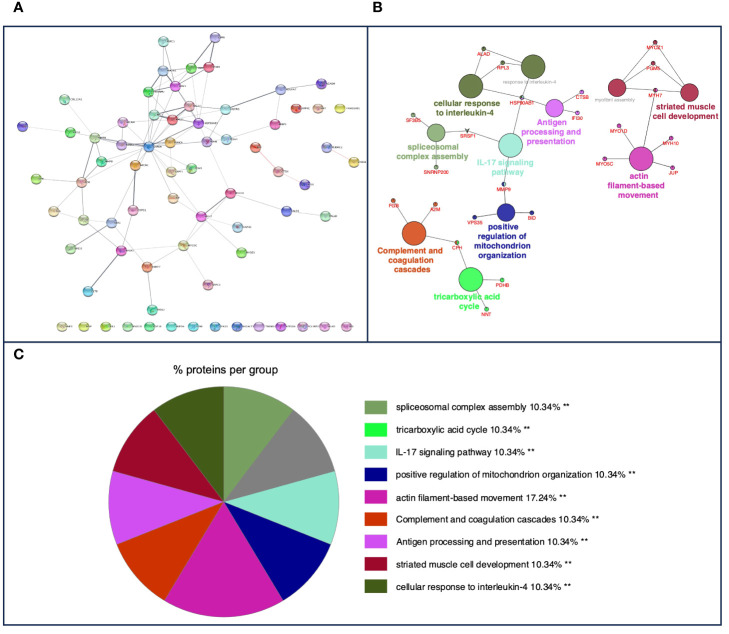
Figure 4.
(A) Protein–protein interaction (PPI) network of 71 overlapped nodes and 93 edges from common m/z features among bovine and porcine obtained using the STRING database and visualized using Cytoscape. (B) Functional network from cattle and pig common m/z features was visualized using Cytoscape with ClueGo and CluePedia, incorporating biological processes (BP), immune system processes (ISPs), and Kyoto Encyclopedia of Genes and Genomes (KEGG) for enrichment of the pathways. Terms are displayed by nodes (colored circles), with node size being directly proportional to p-value ≤0.05. Terms are linked by edges (lines) based on their kappa score. Only statistically significant terms have been considered. (C) Sector diagram representing the proportion of proteins associated with the top functional groups from cattle and pig common m/z expressed in a pie chart according to Gene Ontology (GO) terms specific to each group. A value of p ≤ 0.05 shows significantly enriched GO terms. **p ≤ 0.01.

