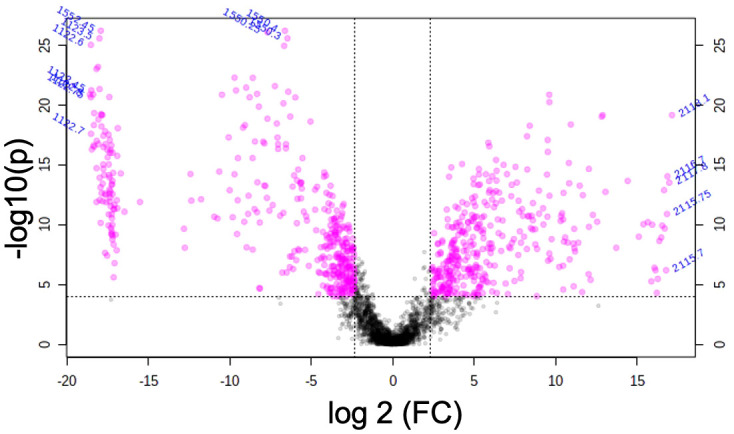
Figure 5.

Volcano plot representation of the m/z features obtained from bovine and porcine granulomas by matrix-assisted laser desorption/ionization mass spectrometry imaging (MALDI-MSI). Magenta dots represent differentially expressed m/z in both species, while black dots correspond to non-differentially expressed m/z [false discovery rate (FDR) <0.0001 and log2 FC ≥ 2].
