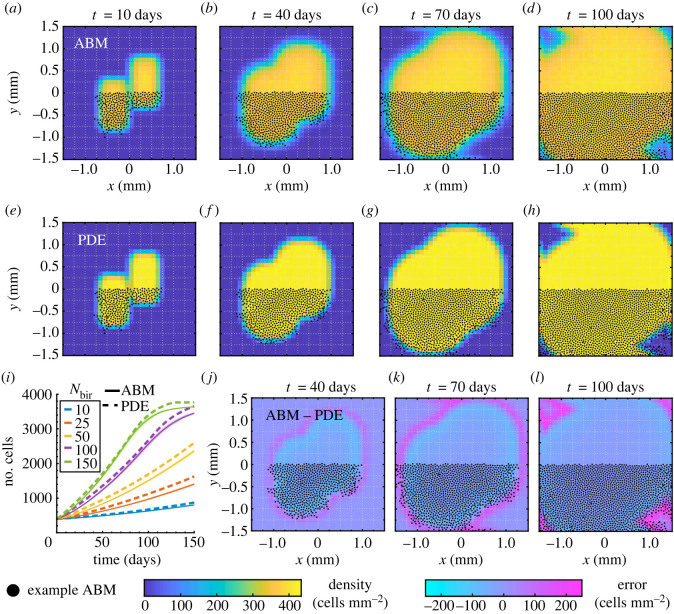
Figure 11.
Melanophore movement and birth models with our Offset rectangles initial condition to verify that our fitting procedure is robust in non-standard geometries. Results in (a–h) and (j–l) are for Nbir = 150 positions day−1. As in figure 10, we show (a–d) the EA ABM result across 103 simulations; (e–h) the corresponding PDE solution with c+ = 7.0686 cells and the values of and γ that we estimated in §§3.1 and 3.2, respectively; (i) the PDE cell mass in time compared to the mean number of cells across 103 ABM simulations for different Nbir values; and (j–l) the difference between the PDE and EA ABM solutions from (a–h). To provide more intuition, we overlay some cell positions from one ABM simulation.

