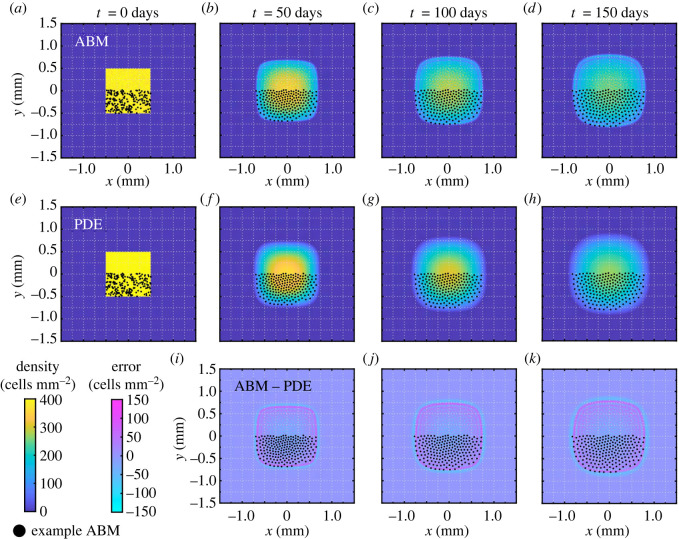
Figure 5.
Melanophore movement models with our Box initial condition. We present (a–d) snapshots of the EA cell density (cells mm−2) across 104 ABM realizations, (e–h) the corresponding PDE results using the optimal value of for a mesh resolution of , and (i–k) the error between the PDE and EA ABM densities. We overlay cell positions for one example ABM simulation (black points) as a visual guide; we show roughly half of the region occupied by these cells. A difference in cell density of 150 cells mm−2 in a given voxel corresponds to about 0.0234 cells for this choice of mesh resolution. We find that the average pointwise errors (over voxels where at least one of the EA ABM or PDE solutions is non-zero) are about 28 cells mm−2, 17 cells mm−2, 17 cells mm−2 and 17 cells mm−2 at t = 0, 50, 100 and 150 days, respectively (these values correspond, respectively, to roughly 7%, 4%, 4% and 4% of the maximum cell density of 400 cells mm−2).

