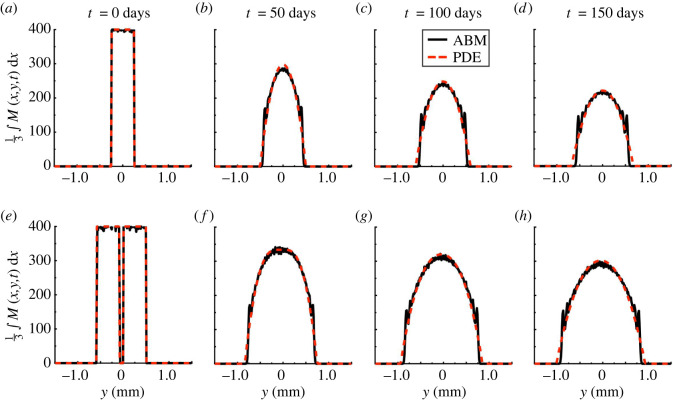
Figure 6.
Melanophore movement models with our Stripe and Two stripes initial conditions. (a–d) We present snapshots of the column-averaged cell density (cells mm−2, black solid line), generated from 103 ABM realizations for the Stripe case, alongside the corresponding PDE solution (dashed red line) under a mesh resolution of and our optimized value of . (e–h) Similarly, we show snapshots of the column-averaged density, generated from 103 ABM realizations for the Two stripes case, and the corresponding PDE solution. The 2D solutions are nearly uniform in the x-direction (data not shown).

