Figure 7.
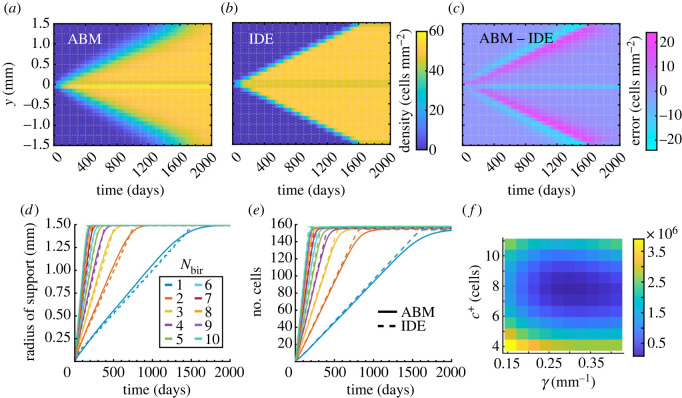
Melanophore birth models with a baseline initial condition of one cell at y = 0 in a 1D domain. Results in (a–c) are for Nbir = 1 positions day−1. (a) We compute the EA ABM result by simulating 103 realizations of our ABM birth model, equation (2.5), and binning cell positions in a histogram with 0.1 mm-wide voxels (i.e. Nhist = 30). (b) We use a finer mesh resolution to solve our corresponding IDE model (equation (2.7)) before transferring results to the same histogram in (a) to perform parameter estimation. Here, we show our IDE solution produced with optimal parameter values c+ = 7.592 cells and γ = 0.2822. (c) The difference between our discrete and continuous results highlights that the ABM support is wider than the PDE support. (d) This is also visible by comparing their mean radii of support in time. To compute the mean radius of support for the ABM at a given time, we find the most distant melanophore from y = 0 for each simulation and average across these values. (e) Cell mass grows linearly in both models at first, but stochastic effects coupled with our overcrowding condition drive down the growth rate of the ABM as the domain fills with cells. (f) Plotting the squared L2 space–time difference between the discrete and continuous densities, summed over all Nbir values considered (namely Nbir = 1, …, 10), as a function of the density-limiting parameter c+ and birth-rate scaling parameter γ highlights its convex shape in c+ and lesser sensitivity to γ. We compute this L2 difference using a time step of 10 days here, and our results are based on 103 simulations for each Nbir value; see electronic supplementary material, S3, for parameter values under alternative choices in our estimation process.

