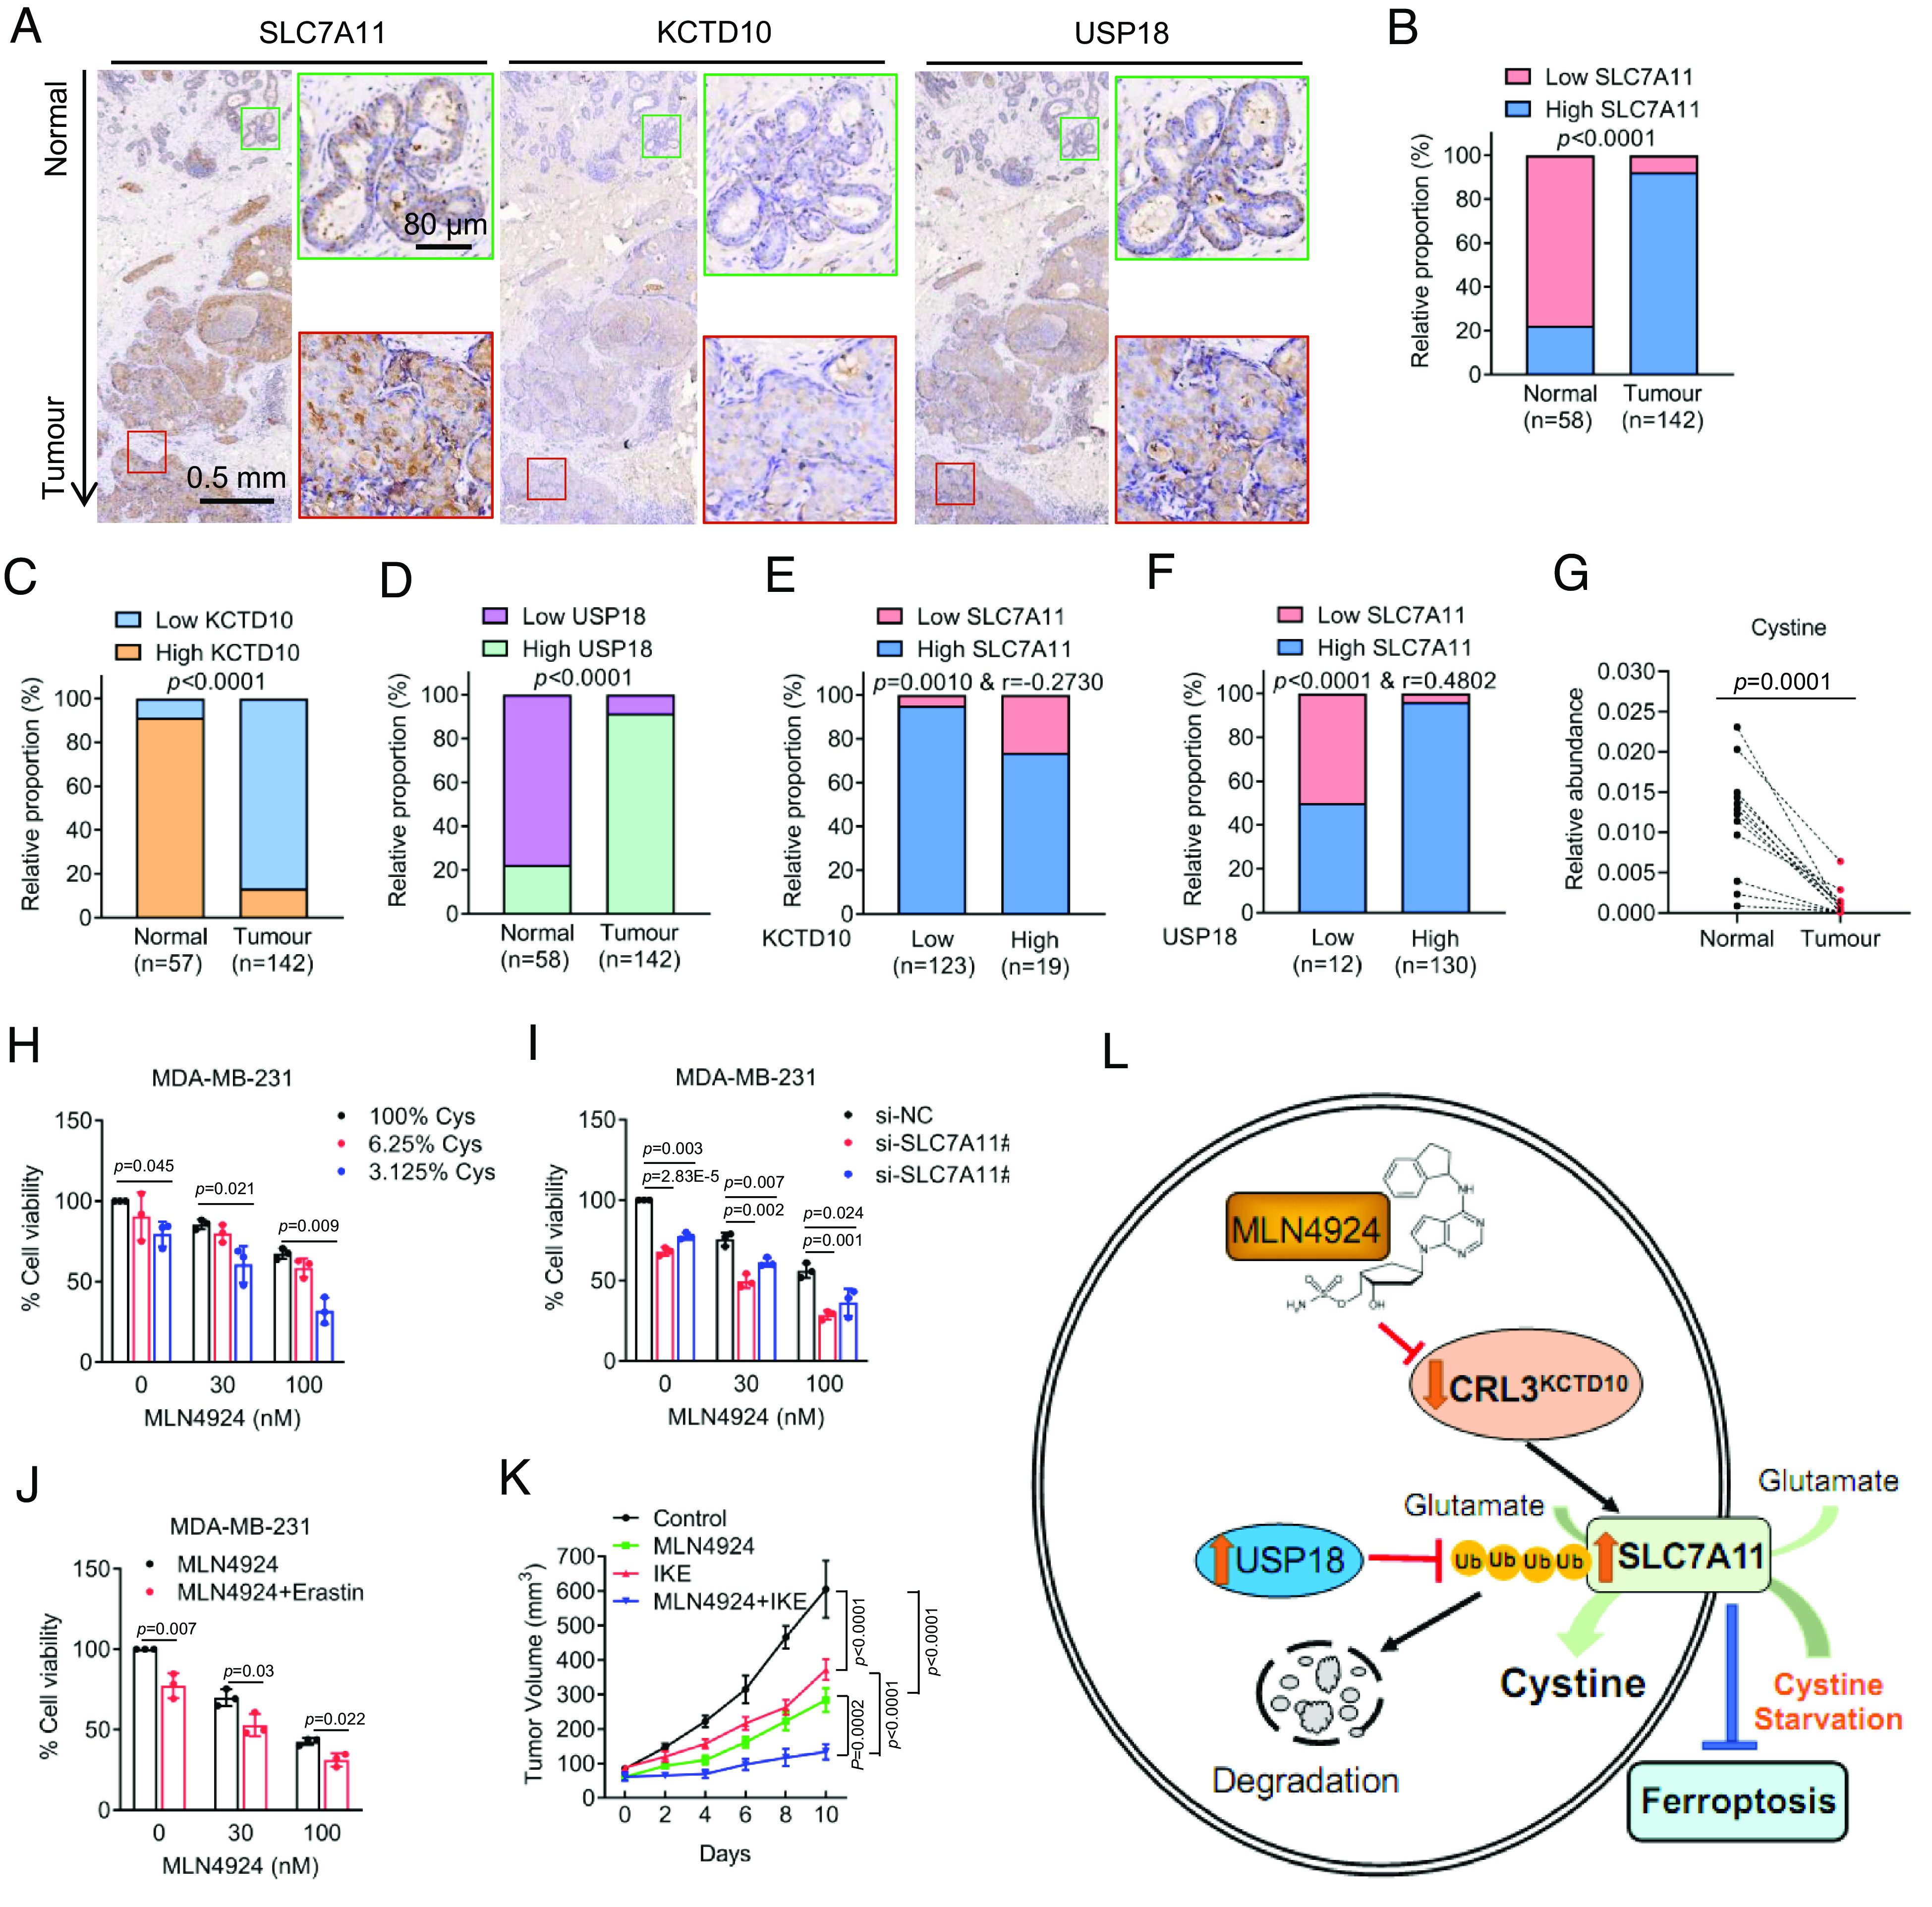
Fig. 7.

Correlation between SLC7A11 and the KCTD10–USP18 axis, and cotargeting neddylation and SLC7A11 enhances cancer killing. (A) Representative staining images of SLC7A11, KCTD10, and USP18 in consecutive breast tissues (normals vs. tumors). The green and red boxes indicate normal and tumor regions, respectively. (B–D) The relative proportion of the levels of SLC7A11 (B), KCTD10 (C), and USP18 (D) by IHC staining in adjacent nontumor and tumor tissues of the breast. (E and F) The correlation analysis of the staining levels between KCTD10 and SLC7A11 (E) as well as USP18 and SLC7A11 (F) in breast tumor sections. (G) Paired human breast normal and tumor tissues were analyzed by targeted metabolomics, and relative abundance of cystine was compared between each individual pair of normal vs. tumor tissues (n = 12). (H) MDA-MB-231 cells were treated with MLN4924 under various percentage of cystine in culture media for 48 h, followed by cell viability measurement (mean ± SD, n = 3). (I) MDA-MB-231 cells were transfected with siRNAs (si-NC or si-SLC7A11s) and then treated with DMSO control or MLN4924 for 48 h, followed by cell viability measurement (mean ± SD, n = 3). (J) MDA-MB-231 cells were treated with different concentrations of MLN4924 without or with Erastin for 48 h, followed by cell viability measurement (mean ± SD, n = 3). (K) The in vivo growth of MDA-MB-231 xenograft tumors after treatment of MLN4924, or IKE, alone or in combination, along with vehicle control for 14 d. Tumor growth was monitored (mean ± SEM, n = 6). (L) A working model: See text for the detail.
