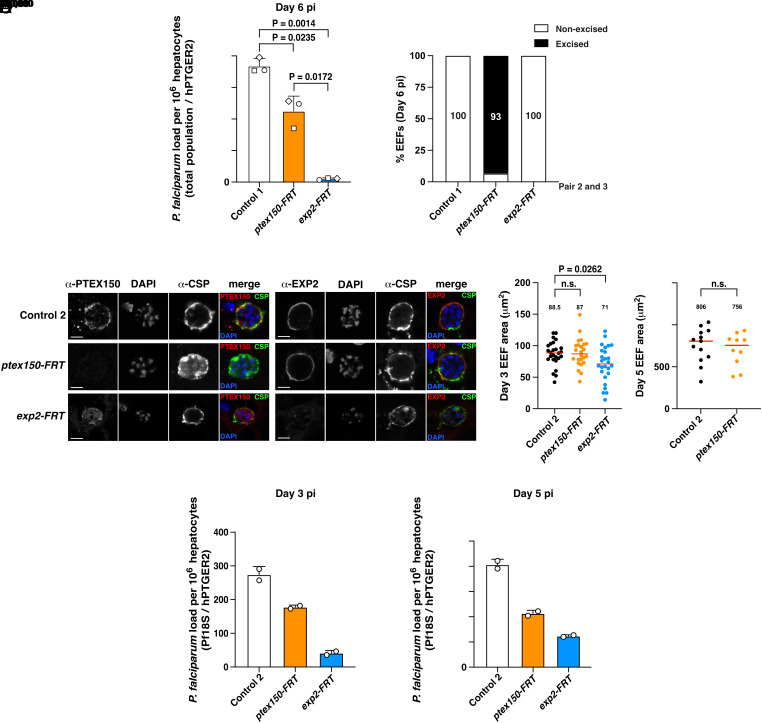
Fig. 4.
PTEX150 and EXP2 are required for P. falciparum liver-stage development. (A) Quantification of parasite liver load coinfected into mice with chimeric human livers 6 d postinfection. Three mice received equal numbers of Control 1, ptex150-FRT, and exp2-FRT sporozoites in the same i.v. injection. Control 1 was used due to its unique genotype relative to ptex-FRT lines, allowing quantification of each parasite line in the coinfected mice. Each mouse is indicated by a different shape. Parasite liver load determined by qRT-PCR, analyzed by one-way ANOVA (Kruskal–Wallis test). (B) Genotyping of EEFs on day 6 from 3 coinfected mice from panel A shows excision of ptex150-FRT and exp2-FRT loci quantified by qRT-PCR using primer pairs 2 and 3. (C) Immunofluorescence microscopy of liver sections from individually infected humanized mice on day 3 postinfection. Mice were infected separately with Control 2, ptex150-FRT, or exp2-FRT sporozoites. (Scale bar, 5 mm.) (D) Area of P. falciparum EEFs on day 3 (Left) or day 5 (Right) postinfection. Data are median, indicated with a number and a red bar within each condition, from n = 23 to 26 (day 3) or n = 10 to 13 (day 5) individual EEFs analyzed by Mann–Whitney t test. P values are shown; n.s., not significant. (E) Quantification of parasite liver load in each humanized mice that were individually infected with Control 2, ptex150-FRT, or exp2-FRT sporozoites in separate injections on day 3 (Left) and day 5 (Right) postinfection by qRT-PCR. Shown are n = 2 technical qRT-PCR replicates as mean ± SEM from one mouse per condition (three mice for day 3, three mice for day 5; six mice total) Values were normalized to a series of pretested DNA standards.

