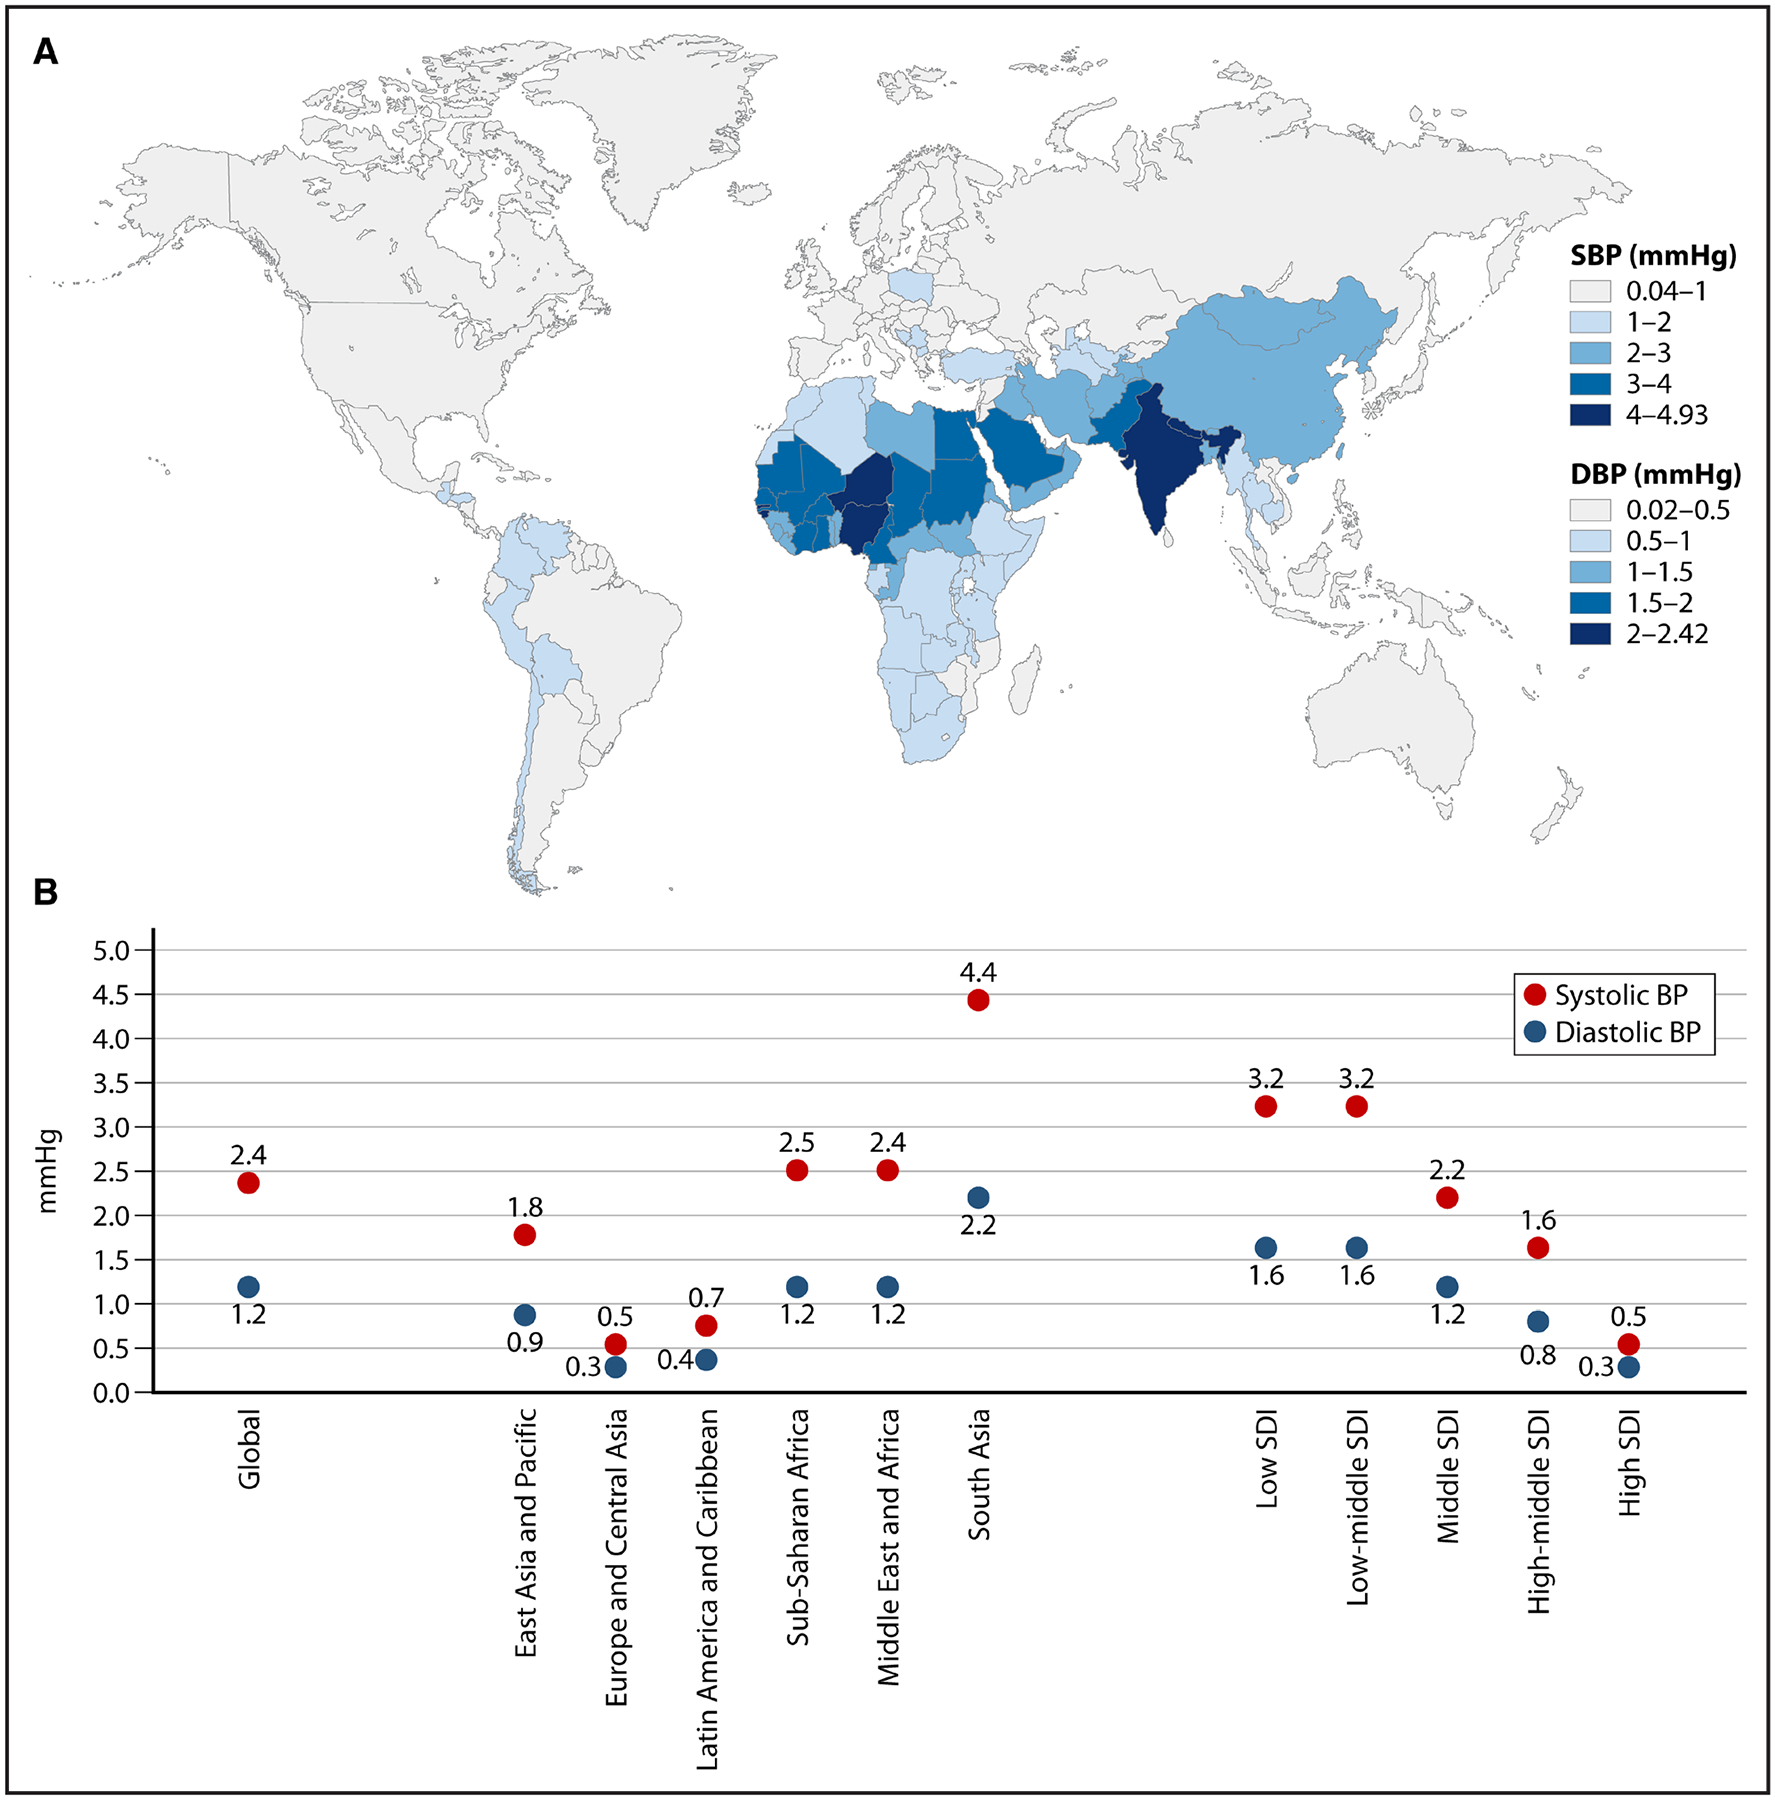
Figure 2. Global relationship between excess blood pressure (BP) and particulate matter <2.5 μm (PM2.5) levels.

A, Geographic distribution of estimated excess BP associated with fine PM2.5 levels above the World Health Organization Air Quality Guidelines of 5 μg/m3 in 2019. B, World map showing excess systolic and diastolic BP (using the 2021 World Health Organization Air Quality Guidelines) in each country and by specific groupings (World Bank regions and sociodemographic index [SDI]). DBP indicates diastolic blood pressure; and SBP, systolic blood pressure.
