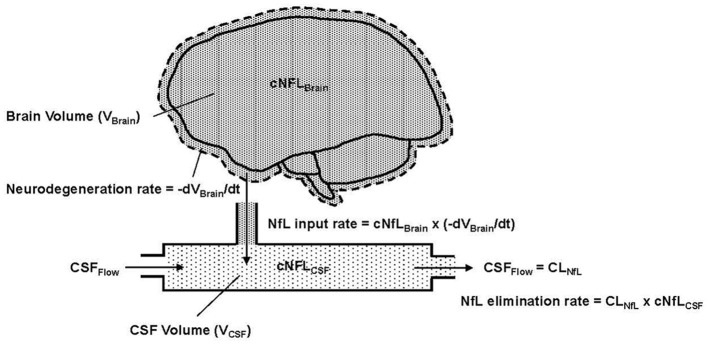
Figure 1.
Conceptual representation of NfL in the brain and CSF, where cNFLBrain (dense pattern) and cNFLCSF (light pattern) indicate the concentrations of NfL in brain tissue and CSF, respectively. VBrain is the volume of brain tissue, VCSF is the volume in the CSF compartment and t is the time variable, which is also equivalent to age in the model. –dVBrain/dt is the negative rate of change of the brain volume; the negative sign expresses this as a positive rate of neurodegeneration. Flow into and out of the CSF compartment is denoted CSFFlow. The observed NfL concentration in CSF can change due to alterations in the rate of neurodegeneration (NfL input to CSF) or CSFFlow (NfL elimination from CSF). The latter is physiologically equivalent to CSF clearance, denoted CLNfL.

