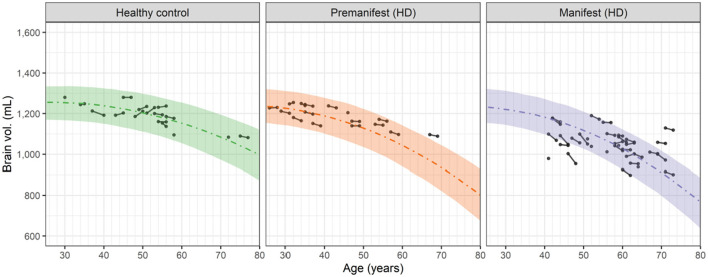
Figure 2.
Observed and predicted dependence of the whole brain volume vs. age for healthy controls, premanifest HD subjects and manifest HD subjects in the HD-CSF study. Filled circles represent individual observations with line segments connecting the baseline and 24-month follow up measurements. A small number of data points had no follow up measurement. Dashed curves correspond to the predicted median values for each group based on the 2nd order polynomials in Equation 4. For premanifest and manifest HD subjects, k2 was computed from Equation 6 using the mean CAG repeat values of 42.0 and 42.75, respectively. Shaded areas represent the 90 percent prediction intervals of the model.

