

Summary
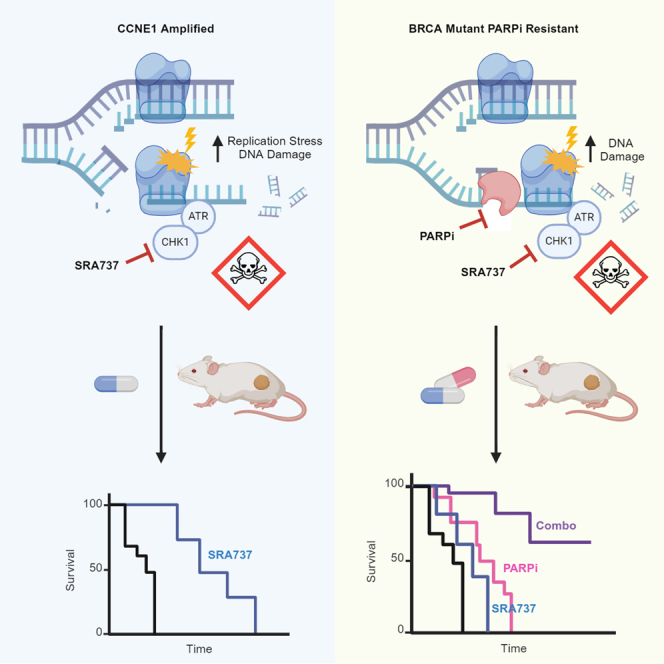
High-grade serous ovarian cancers (HGSOCs) with homologous recombination deficiency (HRD) are initially responsive to poly (ADP-ribose) polymerase inhibitors (PARPi), but resistance ultimately emerges. HGSOC with CCNE1 amplification (CCNE1amp) are associated with resistance to PARPi and platinum treatments. High replication stress in HRD and CCNE1amp HGSOC leads to increased reliance on checkpoint kinase 1 (CHK1), a key regulator of cell cycle progression and the replication stress response. Here, we investigated the anti-tumor activity of the potent, highly selective, orally bioavailable CHK1 inhibitor (CHK1i), SRA737, in both acquired PARPi-resistant BRCA1/2 mutant and CCNE1amp HGSOC models. We demonstrated that SRA737 increased replication stress and induced subsequent cell death in vitro. SRA737 monotherapy in vivo prolonged survival in CCNE1amp models, suggesting a potential biomarker for CHK1i therapy. Combination SRA737 and PARPi therapy increased tumor regression in both PARPi-resistant and CCNE1amp patient-derived xenograft models, warranting further study in these HGSOC subgroups.
Subject areas: Cancer, Cell biology, Molecular biology
Graphical abstract
Highlights
-
•
Selective oral CHK1 inhibitor SRA737 alone is active in CCNE1 amplified models
-
•
SRA737 combined with PARP inhibitor shows synergy in multi-drug resistant cells
-
•
Combination treatment increases replication stress and apoptosis
-
•
Combination shows significant activity in PARPi-resistant BRCA mutant PDX models
Cancer; Cell biology; Molecular biology
Introduction
Approximately 20% of high-grade serous ovarian cancers (HGSOCs) harbor CCNE1 gene amplification (CCNE1amp).1 These tumors show intrinsic resistance to poly (ADP-ribose) polymerase inhibitors (PARPi) and frequently are, or become, resistant to platinum therapy.2,3 CCNE1amp is known to increase replication stress and genomic instability, leading to increased reliance on checkpoint kinase 1 (CHK1).4,5 As an essential effector of the cellular response to replication stress, activated CHK1 stabilizes stalled replication forks, abrogates new origin firing, temporarily arrests the cell cycle, and fosters DNA repair to avoid replication- and mitotic catastrophe-induced cell death.6,7,8,9,10 Thus, CHK1 is an ideal target in CCNE1amp tumors.
A distinct subgroup comprising approximately 50% of HGSOC has defective homologous recombination repair (HRR).11 HRR deficient (HRD) HGSOC are initially sensitive to PARPi,12 but drug resistance ultimately emerges, frequently involving genetic reversion of BRCA1/2 mutated genes and partial restoration of HRR.13,14,15,16 Mutations in certain genes, for example BRCA1/2, impair replication fork stability and/or HRR (HRD settings). CHK1 inhibition increases replication stress, destabilizes replication forks, and impairs HRR. Consequently, CHK1 inhibition in combination with PARPi may (1) deepen responses in HRD tumors and (2) overcome resistance induced following PARPi-therapy.
Here, we investigated the in vitro and in vivo anti-tumor activity of the potent, highly selective, orally bioavailable small molecule inhibitor of CHK1 (CHK1i), SRA737, in CCNE1amp HGSOC and in HRD HGSOC models with acquired PARPi-resistance. SRA737 was selected for these studies as it was determined to be the best selective CHK1 inhibitor (CHK1i) candidate for clinical development available at the time. We hypothesized that intrinsically elevated replication stress, as a result of cyclin E overexpression, would predispose these tumors to CHK1i-induced catastrophic genomic instability following monotherapy treatment with SRA737. For HRD tumors, we hypothesized that defective HRR (e.g., BRCA1/2 mutation) may elevate sensitivity to CHK1i, SRA737 either alone or in combination with PARPi, given the well-established role of CHK1 in HRR, as well as other aspects of the replication stress response. Herein, we focused this study on CCNE1 amplified/cyclin E1 over-expression and HRD platinum- and PARPi-resistant models of HGSOC, representing the most challenging patients to treat in the clinic.
Results
SRA737 monotherapy increased replication stress, DNA double-strand breaks, and tumor regression in CCNE1amp models
To assess the activity of SRA737 monotherapy in oncogene-driven HGSOC, the ability of OVCAR3 cells (CCNE1amp) to form colonies was determined 12 days following treatment with vehicle or SRA737 (Figure 1A). Greater than 50% inhibition of colony area was evident with as low as 100 nM SRA737. RPA-bound ssDNA, a hallmark of replication stress, is recognized by ataxia telangiectasia and Rad3-related (ATR) kinase, contributes to the activation of the cellular replication stress response, and involves phosphorylation of key substrates including RPA (p-RPA32).17,18,19 Activated ATR also phosphorylates CHK1 at S317 and S345,20 leading to CHK1 activation and autophosphorylation at S296. Accordingly, within 24 h of SRA737 exposure, ATR was activated, as indicated by a substantial increase in p-CHK1 (S345; Figure 1B) and CHK1 activity was inhibited, supported by reduced phosphorylation at site S296. SRA737 also led to an increase in γ-H2AX, an indicator of DNA double-strand breaks and replication fork collapse. Subsequent FACS analysis of DNA bound p-RPA32 and γ-H2AX confirmed these findings (Figure 1C). Taken together, data in OVCAR3 cells showed that monotherapy SRA737 increased replication stress and DNA double-strand breaks within 24 h, resulting in reduced colony-forming ability.
Figure 1.

SRA737 is active as monotherapy in a CCNE1amp HGSOC xenograft, resulting in replication stress and dsDNA breaks
(A) OVCAR3 cells (CCNE1amp) were treated with vehicle or SRA737 (0.1 or 0.2 μM) for 12 days. Crystal violet staining was quantified using ImageJ and percent of control was calculated. Data are representative of three independent experiments. Mean ± SD (n = 3), one-way ANOVA with Dunnett’s multiple comparisons post-hoc test compared to the control ∗∗∗∗, p < 0.0001.
(B) OVCAR3 and PARPi resistant PEO1 (PEO1-PR) cells were treated with vehicle or SRA737 (0.2 μM) for 24 h prior to cell lysis and Western blot analysis for indicated markers.
(C) FACS analysis for DNA bound p-RPA32 and γ-H2AX expression in OVCAR3 cells following 24 h of treatment with vehicle or SRA737 (1 μM).
(D) Mice bearing subcutaneous OVCAR3 tumors were treated with SRA737 (25, 50, 100 or 150 mg/kg QD, PO) or vehicle for three cycles of 5 days on/2 days off (n = 10). Tumor volume was calculated from twice weekly caliper measurements, and data are represented as mean ± SEM. Data were analyzed by one-way ANOVA comparison of the average area under the curve. Statistical significance is shown compared to the vehicle control, ∗, p < 0.05 and ∗∗∗∗, p < 0.0001.
(E and F) OVCAR3 tumor bearing mice were treated with a single dose of SRA737 (25, 50, 100 and 150 mg/kg) or vehicle and the tumors were collected 12 h later. (E) Representative immunohistochemistry for p-CHK1 (S345) and γ-H2AX in vehicle and SRA737. Quantification of percent nuclear p-CHK1 (S345) or γ-H2AX staining intensity relative to the vehicle mean. Statistical significance is shown compared to the vehicle control (n = 3, Mean ± SD; one-way ANOVA; ∗∗, p < 0.01, ∗∗∗, p < 0.001, ∗∗∗∗, p < 0.0001). (F) Tumor lysates prepared from three animals per treatment group were analyzed by Western blot for indicated markers. See also Figure S1.
To determine if SRA737 monotherapy has anti-tumor efficacy against CCNE1amp tumors in vivo, mice bearing subcutaneous OVCAR3 tumors were treated with SRA737 (25, 50, 100, or 150 mg/kg QD, PO) or vehicle for three cycles of 5 days on/2 days off. Tumor growth was inhibited in a dose dependent manner (Figure 1D). In groups dosed with 100 mg/kg and 150 mg/kg, significant tumor growth inhibition was observed until study termination, six days after the last treatment (area under the curve (AUC), p < 0.05 and p < 0.001, respectively). These results suggested that CCNE1amp ovarian tumors with high intrinsic replication stress were heavily reliant on CHK1 activity, with consequent sensitivity to SRA737 therapy.
To demonstrate that replication stress was induced by SRA737 in vivo, OVCAR3 tumor bearing mice were treated with a single dose of SRA737 or vehicle, and tumors were harvested 12 h post treatment. Immunohistochemistry showed a significant increase in nuclear staining of γ-H2AX and p-CHK1 (S345) in tumors from mice dosed with 100 or 150 mg/kg SRA737 (Figure 1E). Tumor lysates analyzed by western blot revealed that dose-concordant increases in markers of replication stress/fork stalling (ATR phosphorylation sites on CHK1 (S317 and S345) and p-RPA32 (S33)) and fork collapse (γ-H2AX) were observed (Figures 1F and S1A). These results suggested that selective inhibition of CHK1 in CCNE1amp tumors with high intrinsic replication stress resulted in excessive replication stress, DNA damage, and genomic instability that was incompatible with tumor cell survival.
SRA737 increased survival in CCNE1amp HGSOC PDX models
SRA737 efficacy was tested as a monotherapy in three platinum-resistant or refractory CCNE1amp PDX models of HGSOC: #WO-19, #29, and #111 (Figures 2A–2C). All three models harbored genetic amplifications in CCNE1 resulting in over-expression of the protein (Table S1; Figures 2E and 3). Orthotopic PDX model WO-19 was resistant to 30 mg/kg carboplatin, and subcutaneous PDX models #29 and #111 were refractory to 4 mg/kg cisplatin.
Figure 2.

SRA737 is active as a monotherapy in ovarian cancer CCNE1amp PDX models
(A–D) PDX models were tested for response to standard of care carboplatin (WO-19) or cisplatin (#29, #111, #1177), PARPi, and SRA737 in vivo. Tumor volume growth curve (left and middle) and survival analysis (right) after randomization. Tumor growth shown is mean ± SEM. Longitudinal analysis by Linear Mixed-Effects modeling with type II ANOVA and pairwise comparisons across groups. Survival is shown by Kaplan–Meier curve using the Mantel-Cox log rank test. Statistical significance is shown comparing the highest dose of SRA737 tested for each model and PARPi or vehicle control as indicated (∗, p < 0.5, ∗∗, p < 0.01, ∗∗∗, p < 0.001). A, Platinum-resistant HGSOC WO-19 tumors were orthotopically implanted of recipient mice. Once tumors reached ∼80 mm3 by ultrasound measurements, mice were assigned to vehicle (n = 4), SRA737 (50 mg/kg; PO, 5 days on/2 days off; n = 8) or PARPi (50 mg/kg; PO; n = 5). B-D, PARPi-resistant and platinum-refractory #111 and #29 HGSOC and #1177 carcinosarcoma tumors were subcutaneously implanted on the left flank of recipient NSG mice. Once tumors reached 180-250 mm3, mice were assigned to vehicle, SRA737 (100 mg/kg or 50 mg/kg or 25 mg/kg; PO, 21 days continuous dosing) or PARPi (100 mg/kg; IP, 5 days on/2 days off for 3 weeks) (#111, n = 10–11; #29, n = 6; #1177, n = 3–17, per group). See also Figure S1.
(E) PDX tumors were analyzed for cyclin E1 protein levels by immunohistochemistry and histopathologic review confirmed high (H-Score >150) cyclin E1 expression (see also Figure 3). Scale bars indicate 100 μm.
Figure 3.

Drug response heatmap and oncoprint of PDX tumor characteristics
Drug response data, cyclin E1 copy number and protein expression for all PDX models are summarized using a heatmap. Gene alterations present in the PDX models used in this study are presented as an oncoprint (see also Table S1). ND, no data; SD, stable disease; PD, progressive disease; VUS, variant of uncertain significance; SNV, single nucleotide variant.
WO-19 tumors were orthotopically implanted onto the fallopian tubes/ovaries of recipient mice. Once tumors reached ∼80 mm3, mice were randomized to vehicle, SRA737 (50 mg/kg; PO, 5 days on/2 days off) or PARPi (50 mg/kg; PO, QD) and were treated until disease progression for evaluation of survival endpoint. SRA737 resulted in a significant reduction in tumor burden compared to vehicle (p = 0.0002) at clinically achievable human equivalent dosing and schedule. SRA737 treatment also resulted in profound survival benefit by increasing the median survival from 4 weeks to 11 weeks as compared with vehicle or PARPi alone, in this platinum-resistant model (p = 0.0005 and p = 0.0106, respectively) (Figures 2A and S1C).
To test the durability and dose dependence of SRA737, HGSOC PDX tumors were subcutaneously implanted into NSG mice. Once tumors reached 180-250 mm3, mice were randomized to vehicle, SRA737 (100 mg/kg, 50 mg/kg, or 25 mg/kg; PO, QD) or PARPi (100 mg/kg; PO, 5 days on/2 days off). SRA737 was given daily for 21 days, while PARPi was dosed 5 days per week for 3 weeks. Tumor volume was assessed twice weekly until experimental endpoint (>700 mm3 requires harvest per animal protocol). SRA737 demonstrated dose-dependent responses in CCNE1amp platinum-refractory PDX models, with tumor regression observed in PDX #29 and tumor growth delay in PDX #111 (Figures 2B, 2C, S1D, and S1E). The highest dose of SRA737 (100 mg/kg) significantly increased the median time to harvest (TTH) compared to control and PARPi-treated mice in both platinum-refractory models, PDX #29 (87 days vs. 33 days vs. 47 days, p = 0.0027 and p = 0.0014) and PDX #111 (81 days vs. 43 days vs. 47 days, p < 0.0001 for both).
Ovarian carcinosarcoma (OCS) is related to HGSOC and believed to be derived from HGSOC by a process of epithelial to mesenchymal transition.21,22 Carcinosarcomas have CCNE1 amplification ∼40%, and patients have a particularly poor outcome, warranting new therapies. Therefore, we extended our studies to test SRA737 in a highly aggressive and sarcomatous PDX model of CCNE1 amplified OCS, PDX #1177 (Figure S2). Treatment of PDX #1177 with 100 mg/kg SRA737 for three weeks (PO, 5 days on/2 days off) resulted in significant tumor regression, with complete response in four out of six tumors (Figures 2D and S1F). The median TTH was significantly extended from just 15 days for vehicle to 106 days for the SRA737 treated group in this platinum-refractory PDX model (p < 0.0001).
Overall, SRA737 monotherapy was efficacious in all CCNE1amp PDX models tested - three models of HGSOC and one of OCS. SRA737 was generally well tolerated as total white blood cell count and platelet levels remained steady over the duration of these studies (Figure S1B). The limited, or indeed, absent efficacy observed for single agent PARPi in these models was consistent with the lack of clinical efficacy reported for PARPi in this highly aggressive HR-competent subset of HGSOC.23
SRA737 was synergistic with PARPi in HR-deficient and PARPi-resistant HGSOC cancer cell lines
PARPi has been shown to synergize with CHK1 inhibition to induce apoptosis in breast and other carcinoma cell lines through ERK1/2 activation.24,25 Here, we expand these efforts to investigate whether CHK1i (SRA737) can sensitize drug-resistant HGSOC to PARPi. A panel of homologous recombination deficient (HRD) PARPi-sensitive (JHOS4, BRCA1MUT; PEO1, BRCA2MUT), HRD PARPi-resistant (JHOS4 PR, BRCA1MUT; UWB B1+, BRCA1+; PEO1 PR, BRCA2MUT; PEO4, BRCA2REV; Kuramochi, BRCA2MUT) and CCNE1amp PARPi-resistant (OVCAR3 and FUOV1) HGSOC cell lines were tested using SRA737 and PARPi in colony formation assays (Figures 4A–4C and S3A). When cells were exposed to SRA737 at increasing doses (0.1, 0.2, and 0.5 μM), single agent SRA737 resulted in greater than 75% and 90% inhibition at 0.5 μM in BRCA1 and BRCA2 mutant HGSOC cell lines, and in PARPi-resistant HGSOC cell lines e.g., in Kuramochi, 0.2 μM SRA737 reduced colony size by 50.2% (p < 0.0001). When administered in combination, SRA737 with PARPi further decreased colony area in both HRD HGSOC cell lines (CDI <1 indicates synergy; best JHOS4 best CDI = 0.45; best PEO1 CDI = 0.007). Synergy BLISS model data provided support for PARPi-SRA737 combination therapy having additive effects in PARPi-sensitive HRD HGSOC cell lines (BLISS score −10 to 10 indicates additivity; JHOS4 -6.0 ± 7.9; PEO1 -8.5 ± 6.0), and synergistic effects in PARPi-resistant HRD HGSOC cell lines (BLISS score <10 indicates synergy; e.g., JHOS4 PR 40.2 ± 4.1; PEO1 PR 72.5 ± 10.7) and in CCNEAMP lines (Figure S3A). These data suggested that not only did SRA737 exert single-agent activity in HRD cell lines, but SRA737 also synergized with PARPi in this profoundly drug-resistant setting.
Figure 4.

Dual inhibition of CHK1 and PARP induce replication stress and DNA damage in PARPi-resistant cells
(A) Colony formation assay on cell lines treated with SRA737 (0.1 μM in Kuramochi; 0.2 μM in JHOS4, UWB B1+, PEO1-PR, PEO4, OVCAR3; 0.5 μM in PEO1, JHOS4 PR, FUOV1), Olaparib (0.1 μM in JHOS4; 0.2 μM in PEO1; 0.5 μM in Kuramochi, OVCAR3; 1 μM in JHOS4 PR, UWB B1+, PEO1 PR, PEO4, FUOV1), or combination for 10 days.
(B) Colonies were quantified using ImageJ. Data shown as mean ± SD (n = 3) of a single representative experiment. One-way ANOVA analysis with Tukey’s multiple-comparisons test were performed and statistical significance is shown comparing single agent to combination treatment (∗, p < 0.05, ∗∗∗∗, p < 0.0001).
(C) Mean value (%) of colony formation in (B) was used to calculate the coefficient of drug interaction (CDI). CDI <1 indicated synergism, CDI <0.7 significant synergism, CDI = 1 additivity, CDI >1 antagonism.
(D) Western blot analysis for cyclin E1 protein expression in cell lines.
(E) Western blot analysis for pCHK1(S345 and S296) 24 h after cells were treated with 1 μM PARPi (except PEO1 0.2 μM), SRA737 at indicated dosages (PEO1, PEO1-PR: SRA737 0.2 μM; JHOS4, JHOS4-PR: SRA737 1 μM, OVCAR3 and FUOV1: SRA737 0.5 μM).
(F–H) Cells were treated with optimal doses as indicated in E. After 24 h, FACS analysis was performed pRPA32(S33) (F) and S-phase specific -H2AX (G). After 72 h, FACS analyses was performed to detect Annexin/PI + cells (H). Data are representative of 3 individual experiments, and statistical significance is shown comparing SRA737 and combination treatment (∗, p < 0.05, ∗∗∗∗, p < 0.0001, one-way ANOVA).
(I) Western blot analysis for cleaved caspase-3 after cells were treated as in D for 72 h. See also Figure S3.
SRA737 synergized with PARPi to induce replication stress, DNA damage, and apoptosis in HGSOC cell lines
PARPi-resistant JHOS4 PR (BRCA1MUT), PEO1 PR (BRCA2MUT), FUOV1, and OVCAR3 (CCNE1amp) cells were further tested for the mechanism by which SRA737 and PARPi synergistically inhibit tumor cell growth. Parental PEO1 and JHOS4 cells with PARPi sensitivity were used as a comparison. Cyclin E1 protein expression was assessed in all cell lines and shown to only be high in FUOV1 and OVCAR3 (Figure 4D). Exposure to SRA737 for 24 h resulted in target specific phosphorylation of CHK1 (S345) in all PARPi-resistant cells (Figure 4E). Minimal change in CHK1 phosphorylation was seen in PARPi-resistant cells with PARPi alone. Conversely, pCHK1 (S296), the autophosphorylation site of CHK1, was increased after olaparib monotherapy and reduced after the addition of SRA737 to PARPi. Next, the level of replication stress and DNA double-strand breaks was assessed by flow cytometry after 24 h of treatment (Figures 4F, 4G, S3B, and S3C). In all cell lines tested, combination treatment significantly increased pRPA32(S33) and S-phase specific γ-H2AX expression compared to PARPi and SRA737 monotherapy (p < 0.0001).
Since SRA737 induced replication stress as evidenced by pRPA foci induction, as well as DNA double-strand breaks as evidenced by γ-H2AX foci induction, we investigated the degree of cell death occurring by apoptosis, as evidenced by induction of Annexin V staining. In PARPi-sensitive cells, PARPi and SRA737 monotherapy induced similar levels of apoptosis. However, in PARPi-resistant cells, only SRA737 alone increased the percentage of cells undergoing apoptosis, without additional benefit from PARPi. Combination therapy increased apoptosis compared to monotherapy in all cell lines tested (p < 0.0001; Figure 4H). Moreover, cleaved caspase-3 protein was detected at increased levels in cells after treatment with combination SRA737 and PARPi (Figure 4I). Together, these data demonstrated that SRA373 synergized with PARPi to increase DNA replication stress and DNA-damage in S-phase followed by apoptosis.
SRA737 in combination with PARPi is active in HRD HGSOC PDX
To determine if the synergy observed in vitro for PARPi-resistant cells translated to in vivo efficacy, SRA737 and PARPi combination therapy was tested in five HGSOC PDX models. Two HR competent CCNE1 amplified HGSOC PDX models were assessed for synergistic response to CHK1 and PARP inhibition with a 3-week treatment regimen. PDX #111 and #201 both showed no response to olaparib, but significant single agent response to SRA737 (p = 0.0026 and p = 0.0017, respectively) (Figures 5A, S4A, and S4D). Combination PARPi+SRA737 showed a trending increase in survival compared to SRA737 monotherapy, however, this did not reach statistical significance (Table S2). Interestingly, #111 tumors harvested after 2 weeks of treatment showed a higher percentage of pCHK1 positive cells when treated with SRA737 + PARPi than when treated with SRA737 alone (Figure 5D) suggesting combination effects whilst on treatment.
Figure 5.

SRA737 is active in combination with PARPi in HGSOC PDX
(A–D) Tumor volume growth curve (left), survival analysis (middle), and body weight (right) after randomization. Tumor growth shown is mean ± SEM. Longitudinal analysis by Linear Mixed-Effects modeling with type II ANOVA and pairwise comparisons across groups. Survival is shown by Kaplan–Meier curve using the Mantel-Cox log rank test. Statistical significance is shown comparing PARPi and PARPi-SRA737 combination (∗, p < 0.5, ∗∗, p < 0.01, ∗∗∗, p < 0.001). Body weight change (%) from baseline +/− SEM are plotted. Representative images of IHC for cyclin E1 staining are shown. Scale bars indicate 100 μm. (A and B) PARPi-resistant and platinum-refractory #111 (n = 7–8) and #206 (n = 6–7) HGSOC tumors were subcutaneously implanted on the left flank of recipient NSG mice. Once tumors reached 180–250 mm3, mice were assigned to vehicle, SRA737 (75 mg/kg; PO, 21 days continuous dosing), PARPi (75 mg/kg; IP, 5 days on/2 days off for 3 weeks) or SRA737+PARPi. CDI = 1.1 for #111 and 1.0 for #206. (C) Orthotopically implanted HGSOC tumors collected from a platinum resistant patient were treated with PARPi until PARPi-resistance developed (24 weeks) and were then harvested. After a second implantation, tumors reaching 50 mm3 were grown in the presence of PARPi (50–100 mg/kg; most 75 mg/kg; QD) until tumors grew to 100 mm3. At that time, mice either remained on PARPi (75 mg/kg; QD) or were switched to SRA737 (75 mg/kg; 5 days on/2 days off) alone or in combination with PARPi. CDI = 1.2. (D) PDX #111 tumors harvested after two weeks of treatment were stained for pCHK1 (Ser345) and γH2AX. See also Figure S4 and Table S2. Representative IHC images for each treatment and antibody are shown. STARDIST analysis was performed to determine % positive cells. Each point represents the mean % positive cells for each tumor from 9 fields of view per tumor, two independent tumors for each treatment. Scale bars indicate 50 μm.
We next investigated the efficacy of the SRA737 + PARPi combination in two HRD HGSOC PDX models. PDX #206 harbored a BRCA1 mutation, however, we did not observe a significant increase in survival when treated with olaparib at 75 mg/kg (p = 0.0985) (Figures 5B and S4B). Neither did we observe a response to SRA737, even though this PDX had MYC amplification (Table S1). However, for the combination of PARPi with SRA737, we observed an extended median TTH compared to either PARPi or SRA737 alone (92 days vs. 71 days vs. 75 days respectively; combo vs. PARPi p = 0.0148, combo vs. SRA737 p = 0.0089).
PDX model #931 harbored a BRCA2 mutation with a secondary reversion mutation (reversion allele frequency 50%), which has been shown to restore RAD51 foci formation in this PDX model.26 Single agent PARPi had no effect on survival or tumor volume as expected, since BRCAREV mutations are a known mechanism of resistance to PARPi. SRA737 therapy resulted in a trend toward increased survival compared to vehicle or PARPi alone (p = 0.0808 and p = 0.0002, respectively) (Figure S4E); and the addition of PARPi did not provide additional benefit in this model, even though #931 had a borderline CCNE1 amplification (CN = 6) and moderate cyclin E1 expression (Figure 3). There was a significant Pearson correlation between response (change in median survival in weeks compared to the control) and CyclinE1 protein expression by H-score and SRA373 monotherapy (r = 0.99, p = 0.014), but not combination therapy (r = 0.57, p = 0.44) across these four models. No correlation between CCNE1 amplification and response was observed in this limited sample size.
Finally, we tested the sustained response to PARPi and SRA737 in a platinum-resistant gBRCA2MUT PARPi-sensitive orthotopic PDX model. WO-2 tumors collected from a gBRCA2MUT patient were orthotopically transplanted onto mouse fallopian tubes/ovaries then treated with PARPi (75 mg/mL PARPi (D1-6) until tumors grew to 100 mm3) until PARPi-resistance developed (>2-fold growth) and then randomized to daily PARPi or were switched to SRA737 alone or in combination with PARPi. Monotherapy SRA737 reduced tumor volume and increased survival at both doses administered (Figures 5C and S4C; Table S2). For seven out of eight mice in the SRA737 and PARPi combination group, tumor volume was reduced, and for 50% (four out of eight) mice, a complete response was observed (tumor volume below 30 mm3, the detectable limit, for ≥3 consecutive weeks). Mice administered with combination treatment had a significant reduction in tumor volume compared to either monotherapy (PARPi, p = 0.0456 and SRA737, p < 0.0001). Combination therapy also significantly increased the overall mean survival to 40 weeks compared with 23 weeks for PARPi or 14 weeks for SRA737 monotherapy (p = 0.0080 and p < 0.0001, respectively).
In order to better understand the basis for therapeutic response, RNA sequencing was performed on triplicate untreated tumor aliquots from all seven PDX models analyzed in our study, PDX #206, WO-2, 931, 29, 201, WO-19 and 111, with correlation of gene expression with response to SRA737 monotherapy. Small sample size limited the identification of statistically significant biologically relevant differences, when comparing responder to non-responder PDX models (Figure S5). Many differentially regulated genes were detected between CHK1i responder vs. non-responder PDX models; however, these DEG were largely driven by PDX-specific differential expression and are therefore probably not truly reflective of responder status (see interactive Glimma plot https://doi.org/10.5281/zenodo.10511675; Figure S5). CCNE1 transcripts were significantly higher in the CCNE1amp SRA737 monotherapy responder group (Adj p Value 0.028), however only a log fold change of 1 was observed (Figure S5, and Glimma plot https://doi.org/10.5281/zenodo.10511675). This is consistent with high cyclin E protein expression across all PDX models used in this study, with none having an H-score below 100. Metabolic pathways, in particular amino acid metabolism, were found to be upregulated in the responder group, whereas pathways related to inflammatory signaling (TNF, NF-κB, IL-17) were upregulated in the SRA737 monotherapy non-responder group (Figure 6). Collectively, these in vivo results support the potential clinical utility of the combination of SRA737 plus PARPi to overcome acquired PARPi resistance in HGSOC.
Figure 6.

Pathway enrichment analysis for CHK1i monotherapy responder vs. non-responder PDX models
Differentially expressed genes were tested separately to identify terms that were over-represented. GO terms and KEGG biological pathways were interrogated. KEGG pathways significantly upregulated (A) or downregulated (B) in responsive PDX compared to non-responder PDX are shown. The FDR (false-discovery rate) is calculated from p-values generated by a modified Fisher’s exact test adopted to measure the gene enrichment in annotation terms. The gene count represents how many genes from the input list of significant genes are present in that pathway.
Discussion
Replication stress can be therapeutically targeted by inhibiting the ATR/CHK1 kinase pathway dysregulating the DNA damage response and cell cycle control.27 HGSOC with CCNE1 amplification and BRCA1/2 mutations are genetic subsets with increased levels of replication stress.28 Data presented here demonstrated that CHK1 inhibition by the potent, highly selective, orally bioavailable small molecule inhibitor, SRA737, increased the level of replication stress and DNA double-strand breaks in PARPi-resistant BRCA1/2MUT and platinum-resistant CCNE1amp cells and PDX models.
At the time of study initiation, SRA737 was the only orally bioavailable CHK1-specific inhibitor in development. Prexasertib, a CHK1/2 inhibitor, is administered via I.V. and has high hematologic toxicities, which together limit its clinical utility as a monotherapy and in combination with novel agents. Other CHK1is, such as MK-8776 and AZD7762, were no longer in clinical development due to PK limitations and concerns of toxicities. Ultimately SRA737 was selected for these preclinical experiments as it represented the current best candidate for future clinical development as a monotherapy and in combination with other therapies.
Using the PDX drug-development platform, we demonstrated that SRA737 monotherapy is active in aggressive, drug resistant CCNE1amp HGSOC models. In an orthotopic PDX model (WO-19) established from a platinum-resistant CCNE1amp HGSOC patient, SRA737 demonstrated profound monotherapy activity and survival benefit in this PARPi-and platinum-resistant model. SRA737 also demonstrated efficacy in two highly treatment-resistant CCNE1amp HGSOC PDX models, with tumor regression observed in PDX #29, generated from a chemo naive patient who had rapidly progressive, fatal disease. However, monotherapy with SRA737 resulted only in tumor growth stabilization in the CCNE1amp cisplatin-refractory HGSOC PDX model (#111) from a patient who had received multiple lines of standard care treatment regimens, including lines of platinum-based chemotherapy, anthracycline, and a PARPi. It is interesting to note that PDX with either high CCNE1 copy number or high cyclin E1 protein expression by IHC, were associated with response to SRA737 treatment. In the clinical setting, it has also been observed that either CCNE1 amplification or cyclin E1 over-expression were associated with benefit from treatment with the CHK1i, prexasertib, in HGSOC patients, supporting our findings.29
Other genetic aberrations may impact replication stress and thus demonstrate increased responses to CHK1 inhibition by SRA737. Prior reports show SRA737 activity in MYC-amplified preclinical models of neuroblastoma and lymphoma.30,31 Kristeleit et al., in a Phase I trial of SRA737 monotherapy in solid tumors, report a number of possibly associated genes related to clinical SRA737 response including CCNE1, MYC, FBXW7, and CDK12, where partial response or stable disease was observed in some subjects; however, too few patients with HGSOC harboring these aberrations were included in the study to draw conclusions.32 In our study, a highly significant response to single agent SRA737 treatment was observed in an aggressive and platinum-refractory CCNE1amp ovarian carcinosarcoma (OCS) PDX model. The greater sensitivity in this model may have been due to this tumor harboring not only CCNE1 amplification, but also an FBXW7 mutation, encoding a member of the F box protein family which is known to be a negative regulator of cyclin E (thereby leading to high levels of Cyclin E), as well as very high expression of MYCN, which was identified by RNAseq, all known drivers of replication stress.33,34,35 Two additional PDX models harbored a MYC amplification, with PDX 201 also harboring CCNE1 amplification and being sensitive to SRA737 monotherapy, compared with PDX 206, which was not CCNE1 amplified and did not have sensitivity to SRA737 monotherapy. This suggested that CCNE1 amplification may drive sensitivity, whilst MYC amplification may play a more supportive role.
In order to look more broadly at markers of response vs. resistance to SRA737, RNAseq analysis was performed of all seven HGSOC PDX models used in this study. None of the PDX models used in this study had low cyclin E expression as assessed by IHC, and therefore it was not unexpected that the difference in RNA expression between the CCNE1amp SRA737 responder models and the non-responder models, while significant, was not striking. The PDX models all had similar BLM expression and we did not observe a difference between responders and non-responders as previously reported.29 Whilst small sample size was limiting, metabolic pathways were found to be upregulated in the responder group, whereas inflammatory signaling pathways were upregulated in the SRA737 monotherapy non-responder group (Figure 6). These differences may be driven by the different subtypes in the groups, with the responder group being oncogene driven HGSOC and the non-responders HRD or HRD with acquired PARPi resistance. Inflammation has previously been identified as a feature of HRD HGSOC with BRCA deficient cells showing cGAS/STING activation.36,37
Analogous to PARPi, which were first demonstrated to have robust activity in women with HGSOC harboring BRCA mutations, CHK1i, such as SRA737, appear to be effective in HGSOC with defined genetic backgrounds of high replication stress, such as CCNE1 amplification. However, limited clinical outcomes with monotherapy (NCT02797964)38 highlight the need for combination approaches with SRA737, particularly in the setting of treating women with HGSOC post multiple lines of therapy. Recent phase I/II clinical trial results support combination SRA737 and low-dose gemcitabine as a well-tolerated regimen with partial responses observed in recurrent solid tumors including anogenital, cervical, and BRCA1/2MUT or HRD high-grade serous cancers,39 supporting SRA737 combination strategies in drug-resistant cancers.
In addition to CCNE1amp, we also evaluated SRA737 response in PARPi-resistant HGSOC models from germline BRCA1/2MUT patients. BRCAREV mutations have been identified as a mechanism of resistance to PARPi.16 Consistent with CHK1’s role in HRR, SRA737 was active as a single agent in HRD cell lines, similar to that reported by others.25,40,41 However, activity of CHK1 inhibition by SRA737 in combination with PARPi was greater than monotherapy and led to a more synergistic decrease in colony formation in acquired PARPi-resistant cell models with BRCA1/2 mutations (PEO1 PR, JHOS4 PR, KURAMOCHI) and restored BRCA1/2 function (PEO4, UWB/B1+) than PARPi-sensitive cell lines, consistent with reports showing PARPi in combination with targeting the ATR/CHK1 pathway.34,41,42,43 Preliminary evidence demonstrated improved efficacy of SRA737 in combination with PARPi in two BRCA1/2MUT PARPi-resistant (#WO-2, #206), but not BRCA-reverted (#931), PDX models. Overall, SRA737 demonstrated single agent activity in acquired PARPi-resistant cells, as well as in combination with PARPi in vitro and in vivo, providing an effective means to overcome acquired resistance. More research is required to identify biomarkers predicting response to PARPi combinations and functional biomarkers such as RAD51 which have demonstrated correlation with PARPi sensitivity should be explored further in the clinic.44
In summary, we observed impressive single agent SRA737 activity in CCNE1amp PDX models, and the CHK1i/PARPi combination was synergistic in CCNE1amp cell lines, with a trend for a difference with the CHK1i/PARPi combination in vivo, with lack of statistical significance seen, with the same dosing regimen as that which was more successful in HRD models. Validated biomarkers for predicting response to CHK1 inhibition, for example, denoting high replication stress (i.e., CCNE1amp, MYCN), would be highly valuable and the use of SRA737, especially as monotherapy, should be considered early in the disease course. Hence, SRA737 is a potent, highly selective, orally bioavailable CHK1i that demonstrated activity in PARPi-sensitive, acquired PARPi-resistant BRCA1/2MUT and platinum-resistant CCNE1amp preclinical HGSOC cancer models. These findings support urgent exploration in clinical trials of such aggressive HGSOC types, given an improved chance of combination tolerability with SRA737.
Limitations of the study
As the in vivo studies were performed in two independent institutions with differing approved protocols, the response data cannot be directly compared between all models presented. While we were unable to rank all PDX models used for their response to SRA737, as some were treated with a 3-week regimen and others were treated continuously, it is important to note that, overall, the same conclusions were obtained with both treatment protocols. Additionally, this study is limited in the testing of SRA737 without comparison to other CHK1i currently under development. Further evaluation of additional models with HR-deficiency and HR-proficiency could be evaluated to better identify biomarkers of resistance and response to SRA737 monotherapy or combination with PARPi.
STAR★Methods
Key resources table
| REAGENT or RESOURCE | SOURCE | IDENTIFIER |
|---|---|---|
| Antibodies | ||
| Rabbit anti-phospho-Chk1 (Ser345) (clone 133D3) | Cell Signaling Technology | Cat# 2348 RRID:AB_331212 |
| Rabbit anti-phospho-Chk1 (Ser345) polyclonal | ThermoFisher | Cat# PA5-34625; RRID:AB_2551977 |
| Rabbit anti-phospho-Chk1 (Ser317) (clone D12H3) | Cell Signaling Technology | Cat# 12302; RRID:AB_2783865 |
| Rabbit anti-phospho-Chk1 (Ser296) | Cell Signaling Technology | Cat# 2349; RRID:AB_2080323 |
| Rabbit anti-Histone H2A.X | Cell Signaling Technology | Cat# 2595; RRID:AB_10694556 |
| Rabbit anti-phospho-Histone H2A.X (Ser139) (clone 20E3) | Cell Signaling Technology | Cat# 9718; RRID:AB_10121789 |
| Rabbit anti-RPA32 | Bethyl Laboratories, Inc | Cat# A300-244A; RRID:AB_185548 |
| Rabbit anti-phospho-RPA32 (Ser33) | Bethyl Laboratories, Inc | Cat# A300-246A; RRID:AB_2180847 |
| Rabbit anti-Chk1 (clone EP691Y) | Abcam | Cat# ab40866; RRID:AB_726820 |
| Mouse anti-Chk1 (clone G-4) | Santa Cruz Biotechnology | Cat# sc8408; RRID:AB_627257 |
| Mouse anti-β-Actin (clone 8H10D10) | Cell Signaling Technology | Cat# 3700; RRID:AB_2242334 |
| Mouse anti-GAPDH (clone | Millipore | Cat# MAB374; RRID:AB_2107445 |
| Mouse anti-Cyclin E (clone HE12) | Millipore | Cat# 05–363; RRID:AB_2071085 |
| Mouse anti-cytokeratin (clone AE1/AE3) | Dako | Cat# M3515; RRID:AB_2132885 |
| Rabbit anti-PAX8 | Proteintech | Cat# 10336-1-AP; RRID:AB_2236705 |
| Rabbit anti-Wilms Tumor Protein (WT1) | abcam | Cat# ab15249; RRID:AB_301790 |
| Mouse anti-p53 (clone DO-7) | Dako | Cat# M7001; RRID:AB_10690464 |
| Rabbit anti-Vimentin (clone D21H3) | Cell Signaling Technology | Cat# 5741; RRID:AB_10695459 |
| Secondary antibody information (rabbit) | Cell Signaling Technology | Cat# 7074S; RRID:AB_2099233 |
| Secondary antibody information (mouse) | Cell Signaling Technology | Cat#7076S; RRID:AB_330924 |
| Goat anti-Rabbit IgG (H + L), Alexa Fluor 647 | Thermo Fisher Scientific | Cat# A27040; RRID:AB_2536101 |
| Rabbit anti-phospho-RAD51 (Thr309) | Thermo Fisher Scientific | Cat# PA5-39808; RRID:AB_2556359 |
| Rabbit anti-CyclinE1 (clone D7T3U) | Cell Signaling Technology | Cat# 20808; RRID:AB_2783554 |
| Mouse anti-CyclinE1 (clone HE12) | Merck Millipore | Cat# 05–363; RRID:AB_2071085 |
| Rabbit anti-Cleaved Caspase-3 (clone Asp175) | Cell Signaling Technology | Cat#9661; RRID:AB_234118 |
| Biological samples | ||
| Human HGSOC samples | University of Pennsylvania, BioTrust Collection | https://www.med.upenn.edu/OCRCBioTrust/RRID:SCR_022387 |
| Human HGSOC samples | The Australian Ovarian Cancer Study | http://www.aocstudy.org/ |
| Patient-derived xenografts (PDX) | Scott laboratory, The Walter and Eliza Hall Institute of Medical Research | N/A |
| Patient-derived xenografts (PDX) | Simpkins laboratory, UPenn Ovarian Cancer Research Center | N/A |
| Chemicals, peptides, and recombinant proteins | ||
| Fetal bovine serum | Sigma | Cat# F2442 |
| penicillin/streptomycin | Corning | Cat#30-002-Cl |
| SRA737 | Sierra Oncology | N/A |
| Olaparib | AstraZeneca | N/A |
| Olaparib | MedChemExpress | Cat#HY-10162 |
| Crystal violet | Sigma-Aldrich | Cat#V5265 |
| protease inhibitor | Roche | Cat#04 693 159 001 |
| phosphatase inhibitor | Roche | Cat#04 906 837 001 |
| PVDF membrane | Bio-Rad | Cat#10026933 |
| Tris/Glycine/SDS buffer | Bio-Rad | Cat#161-0732 |
| Trans-Blot Turbo | Bio-Rad | Cat#10026938 |
| DMEM | Corning | Cat#10-013-CV |
| DMEM:F12 | Gibco | Cat#11320-033 |
| RPMI 1640 | Corning | Cat#10-040-CM |
| 0.25%Trypsin-EDTA | Gibco | Cat#25200-056 |
| Phosphate Buffered Saline | Corning | Cat#21-031-CV |
| Bovine serum albumin | Gemini | Cat#700-101P |
| 0.1% Tween 20 | Bio-Rad | Cat#1706531 |
| chemiluminescent substrate | Thermo Fisher Scientific | Cat#1863098 |
| 4% paraformaldehyde | Electron Microscopy Sciences | Cat#15710 |
| 0.01% Triton X-100 | Thermo Fisher Scientific | Cat# HFH10 |
| Propidium iodide | EMD Millipore | Cat#537059 |
| Dimethyl sulfoxide | Fisher Scientific | D128-1 |
| 10% Buffered Formalin | Fisher Scientific | Cat#245-685 |
| Ethanol | Decon Laboratories | Cat#2716 |
| Carboplatin | Hospira, Inc. | Cat# 61703-339-56 |
| DBL Cisplatin (50 mg/50mL) | Pfizer Pty Ltd | GTIN 09313212302734 |
| Critical commercial assays | ||
| BCA kit | Thermo Fisher Scientific | Cat#23228 |
| eBioscience Annexin V Apoptosis Detection Kit | Invitrogen | Cat#88-8007-74 |
| Deposited data | ||
| RNA sequencing for PDX models | European Genome-Phenome Archive | EGAS50000000084 |
| Original code for RNA sequencing analysis | Zenodo | https://doi.org/10.5281/zenodo.10511675 |
| Experimental models: Cell lines | ||
| PEO1 | Dr. Andrew Godwin, University of Kansas | RRID:CVCL_2686 |
| PEO1-PR | Simpkins laboratory, UPenn Ovarian Cancer Research Center | N/A |
| PEO4 | Dr. Andrew Godwin, University of Kansas | RRID:CVCL_2690 |
| OVCAR3 | ATCC (Manassas, Virginia) | RRID:CVCL_0465 |
| JHOS4 | Dr. Ronny Drapkin, University of Pennsylvania | RRID:CVCL_4649 |
| JHOS4-PR | Simpkins laboratory, UPenn Ovarian Cancer Research Center | N/A |
| UWB BRCA1+ | Dr. Roger Greenberg, University of Pennsylvania | N/A |
| Kuramochi | Japanese Collection of Reearch Rioresources Cell Bank | RRID:CVCL_1345 |
| FUOV1 | Leibniz Institute DSMZ | RRID:CVCL_2047 |
| Experimental models: Organisms/strains | ||
| BALB/c nude mice | Shanghai Lingchang Bio-Technology Co. Ltd | N/A |
| NOD-SCID IL2Rγ−/− (NSG) mice | University of Pennsylvania, Stem Cell and Xenograft Core | N/A |
| NOD-SCID IL2Rγ−/− (NSG) mice | The Walter and Eliza Hall Institute of Medical Research, Clive and Vera Ramaciotti laboratories | N/A |
| Software and algorithms | ||
| ImageJ, NIH, Bethesda, MD | Schneider et al.53 | https://imagej.nih.gov/ij/ |
| FlowJo software, BD | N/A | https://www.flowjo.com/solutions/flowjo |
| Graphpad Prism, San Diego, CA | N/A | https://www.graphpad.com |
| Studylog | N/A | https://www.studylog.com/ |
| CaseCenter | N/A | https://www.3dhistech.com/solutions/casecenter/ |
| SynergyFinder 3.0 | Ianevski et al.54 | https://synergyfinder.fimm.fi |
| TumorGrowth | Enot et al.65 | https://kroemerlab.shinyapps.io/TumGrowth/ |
| RStudio | N/A | https://cran.r-project.org/ |
| Other | ||
| BD LSRII cytometer | BD Biosciences | N/A |
| Nikon Eclipse 80i microscope | Nikon | N/A |
| Leica DM 2000 microscope | Leica | N/A |
| Pannoramic 1000 slide scanner | 3DHISTECH Ltd. | N/A |
| SonoSite Edge II Ultrasound System | Ref: P20680 SN: 045NPK Manufactured Date: 08/2016 |
N/A |
| DAKO Autostainer Plus Immunostainer and associated reagents | DAKO | N/A |
| DAKO EnVision Plus System and associated reagents | DAKO | N/A |
| Leica Bond-IIITM Immunostainer and associated reagents | Leica | N/A |
| Bond Polymer Refine Detection System and associated reagents | Leica | N/A |
Resource availability
Lead contact
Further information and requests for resources and reagents should be directed to and will be fulfilled by the Lead Contact, Fiona Simpkins (Fiona.Simpkins@uphs.upenn.edu).
Materials availability
There are restrictions to the availability of the CHK1 inhibitor SRA737 due to material transfer agreement with Sierra Oncology (Vancouver, BC, Canada).
Data and code availability
The following datasets have been deposited in the European Genome-Phenome Archive (EGA), which is hosted by the EBI and the CRG, under accession number EGAS50000000084: RNAseq fastq files for PDX samples: #111, #1177, #201, #206, #29, #931, #WO-19, #WO-2. A data transfer agreement is required. Further information about EGA can be found on https://ega-archive.org "The European Genome-phenome Archive of human data consented for biomedical research".45 Original code used for RNAseq analysis has been deposited in Zenodo with https://doi.org/10.5281/zenodo.10511675. Other data or any additional information required to reanalyze the data reported in this paper is available from the lead contact upon request.
Experimental model and study participant details
Study approvals
Murine models
Cell-line derived xenograft efficacy and pharmacodynamic studies were carried out under approval of the Institutional Animal Care and Use Committee and conducted in accordance with the regulations of the Association for Assessment and Accreditation of Laboratory Animal Care (AAALAC) at Crown BioSciences (Taicang, China). PDX studies were carried out in accordance with animal ethics guidelines approved by the University of Pennsylvania IACUC protocol (#806002) or the Walter and Eliza Hall Institute of Medical Research Animal Ethics Committee (Projects 2016.023 and 2019.024).
Patient samples
Surgical or biopsy samples were obtained with informed consent from the Hospital of the University of Pennsylvania in accordance with IRB (#702679), or from patients enrolled in the Australian Ovarian Cancer Study or The WEHI Stafford Fox Rare Cancer Program. Additional ethics approval was obtained from the Walter and Eliza Hall Institute of Medical Research Human Research Ethics Committee (WEHI HREC projects 10/05 and G16/02).
Generation of orthotopic PDX models
Orthotopic PDX models were developed.46,47 Briefly, at the time of tumor debulking surgery, patient tumors are diced into 2 mm3 fragments. 5 to 8-week-old female NOD-SCID IL2Rγ−/− (NSG) mice from the UPenn Sem Cell and Xenograft Core. A 1 cm incision is made in the skin overlying the dorsal flank. The peritoneum is then incised, and a 5 mm incision is made. The ovarian bursa (contains the ovary and fallopian tube) and the uterine horn are exteriorized. A 2 mm3 fragment is sutured to the ovary and then Matrigel (50 μL) is then applied to the transplant. The ovary is dropped back into peritoneal cavity. The peritoneum is closed with suture. Mice are monitored daily, and tumors are measured weekly. Once the tumor reaches 700–1000 mm3 tumors are resected, tumors were diced and transplanted in a similar fashion (mouse passage 2; MP2). Validation of PDX models WO-2 and WO-19 have been described previously.41,46
Cell-line derived xenograft studies
Exponentially growing OVCAR3 cells (1 × 10⁷) were inoculated subcutaneously in the right flank region of 6-8-week-old female BALB/c nude mice (Shanghai Lingchang Bio-Technology Co. Ltd., Shanghai, China). For the OVCAR3 efficacy study, when tumors reached approximately 150 mm3, mice (n = 10 per group) were orally administered vehicle control (10% DMSO, 5% Tween 80, 20% PEG 400, and 65% saline (DTPW)) or SRA737 (100 mg/kg in DTPW) QD for 5 days out of 7 days for three cycles. Tumor volume was calculated by caliper (V = 0.5 × L × w2) and body weights were obtained twice weekly. For pharmacodynamic studies, when tumor volumes of OVCAR3 bearing mice measured approximately 500 mm3 mice (n = 3 per group) were administered a single dose of SRA737 (25, 50, or 100 mg/kg in DTPW, oral). Tumors were harvested 12 h later with ½ the tumor flash frozen for immunoblot analysis and the other ½ were formalin fixed and paraffin embedded for IHC analysis.
Orthotopic PDX studies
Following expansion of HGSOC PDX in donor NSG mice, tumor fragments (approximately 2 mm3) were surgically implanted on the fallopian tube of female study mice as described above. Tumors were measured weekly by ultrasound (V = [l × w2]/2). When tumor volumes reached approximately 80 mm3 mice were randomized into treatment groups with SRA737 (50–100 mg/kg), olaparib (50–75 mg/kg), olaparib + SRA737, carboplatin (30 mg/kg) or vehicle. SRA737 was dosed by oral gavage 5 days on/2 days off. Olaparib was dosed by oral gavage 6 days on/1 day off. Carboplatin was dosed i.p. once every 28 days.
Subcutaneous PDX studies
PDX were generated by transplanting fresh surgical or biopsy tumor fragments (1-4 mm3) subcutaneously on the flank of 6–8 week old female NSG mice (PDX #29,48 PDX #111,49 PDX #201,50 PDX #206,51 PDX #117752). Any IHC validation not previously published, including for new PDX models #206 and #931, is shown in Figure S2.
Successfully engrafted tumors were expanded into treatment cohorts by serial passaging of tumor fragments (up to passage 10) in NSG mice. Tumors were measured twice weekly with digital calipers and recorded into Studylog software (StudyLog Systems). When tumor volume reached 180-250 mm3 mice were randomly assigned to treatment with SRA737 (25–100 mg/kg, oral gavage, 21 days), olaparib (75 or 100 mg/kg, oral gavage, 5 days on/2 days off for 3 weeks), olaparib + SRA737 (both at 75 mg/kg) or vehicle. Cisplatin was dosed intraperitoneally, 4 mg/kg on days 1, 8, and 18.
Generation of PARPi-resistant cell lines
PARPi-resistant cell lines (PEO1-PR, and JHOS4-PR) were developed by long-term olaparib exposure (>12 months; 0.5–3 μM). Olaparib was obtained from AstraZeneca (Cambridge, UK). Authenticity was confirmed by short tandem repeats by the Wistar Genomics Core (Wistar Institute, Philadelphia, PA).
Method details
Cell lines
PEO1 (BRCA2MUT), PEO4 (BRCA2REV), Kuramochi (BRCA2MUT), FUOV1 (CCNE1amp), and OVCAR3 (CCNE1amp) ovarian cancer cells were grown in RPMI media with 10% FBS and penicillin/streptomycin. PEO1 and PEO4 lines were a generous gift from Dr. Andrew Godwin, University of Kansas, Kansas City, KS. JHOS-4 (BRCA1MUT) ovarian cancer cells were grown in DMEM/F12 media with 10% FBS, and penicillin/streptomycin. UWB BRCA1+ was a gift from Dr. Roger A. Greenberg at the University of Pennsylvania and the cells were grown in RPMI media with 10% FBS and penicillin/streptomycin. PARPi-resistant cell lines (PEO1-PR, and JHOS4-PR) were cultured in respective media with addition of olaparib. Prior to in vitro studies, there was a 10-day washout period. All cells were grown in humidified 5% CO2 conditions and were mycoplasma negative.
Drug formulation for in vivo use
The CHK1 inhibitor (CHK1i) SRA737 was provided by Sierra Oncology (Vancouver, BC, Canada). SRA737 was dissolved in 10% DMSO/5% Tween 80/20% PEG400/65% H20. Each solvent was added in order with water bath sonication to obtain a clear solution. Olaparib was dissolved in DMSO at a concentration of 100 mg/mL. Then 10% 2-hydroxy-propyl-β-cyclodextrin/PBS was added to a final concentration of 10 mg/mL olaparib.
Colony formation
In a 12-well dish, PEO1, PEO1-PR, PEO4, OVCAR3, FUOV1, Kuramochi, UWB B1+ cells were plated at 1×10⁴ cells/well and JHOS4, JHOS4-PR cells at 2×10⁴ cells/well. Cells were allowed to adhere overnight, then were treated with indicated concentrations of SRA737, PARPi or combination. The media containing drugs was refreshed every three days. After 12 days of treatment, the cells were fixed and stained with 0.5% crystal violet dissolved in 20% methanol solution for 30 min. The plates were washed with tap water, scanned, and quantified by ImageJ (National Institutes of Health, Bethesda, MD).53
To analyze the drug interaction between SRA737 and PARPi, the coefficient of drug interaction (CDI) was performed. CDI is calculated with formula CDI = AB/(A × B), where A and B are the relative cell viability of monotherapy compared to controls and AB is the relative cell viability of combination group compared to controls. A CDI <1 indicates synergistic, a CDI <0.7 is considered as significant synergy, CDI = 1 indicates additivity, and CDI >1 suggests antagonism. Additionally, we evaluated synergy using the Bliss independence model score, under the assumption that the combined drugs are acting independently of one another, using the open source web-application SynergyFinder 3.0 (https://synergyfinder.fimm.fi).54 A synergy score > −10 indicates antagonistic, −10 to 10 indicates additivity, and <10 indicates synergism.
Western Blot
Cells were seeded in 6-well plates at 1.5×10⁵ cells/well. For monotherapy, cells were treated with SRA 0.2 μM. For combination, cells were treated with 1 μM PARPi (except PEO1 0.2 μM), SRA737 at indicated dosages (PEO1, PEO1-PR: SRA737 0.2 μM; JHOS4, JHOS4-PR: SRA737 1 μM, OVCAR3 and FUOV1: SRA737 0.5 μM), or combination for 24 h (mechanism study) or 72hrs (cleaved caspase-3), washed with cold PBS and scraped with 2×Laemmli Sample Buffer (4% SDS, 40% glycerol, 0.24 M Tris-HCL, pH 6.8) containing a protease and phosphatase inhibitor cocktail (EMD Millipore, Burlington, MA). The collected cell lysates were heated at 98°C for 12 min. Following protein concentration determination with a BCA kit (BioRad, Hercules, CA), electrophoresis on reducing SDS-PAGE gels were performed. Proteins were transferred to a PVDF membrane (Bio-Rad, Hercules, CA), blocked with 2% BSA (Thermo Fisher) and immunoblotted with primary antibodies for phospho-CHK1 (Ser345, Ser317, S296) (Cat. 2348, Cat. 12302, and Cat. 2349, Cell Signaling Technology (CST), Inc., Danvers, MA), γ-H2AX (Cat. 9718, CST), total H2AX (Cat. 2595, CST), phospho-RPA32 (Ser33; Cat. A300-246A, Bethyl Laboratories, Inc.), total RPA32 (Cat. A300-244A, Bethyl), total CHK1 (Cat. sc8408, Santa Cruz Biotechnology, Inc., Dallas, TX or Cat. ab40866, Abcam, Cambridge, United Kingdom), cleaved caspase-3 (Cat. 9664, CST), β-Actin (Cat. 3700, CST), and GAPDH (Cat. MAB374, Millipore). After incubation with primary antibodies, membranes were washed with TBS solution containing 0.1% Tween 20 (Bio-Rad) and blotted with species-appropriate secondary antibodies conjugated with horseradish peroxidase, followed by 5 min incubation of chemiluminescent substrate (ThermoFisher) and subsequent exposure to film. Data was quantified using ImageJ Software. Protein of interest expression was normalized to the β-actin loading control and the untreated control.
Flow cytometry detection of intracellular protein
Cells seeded in 6 cm dishes at 3×10⁵ cells/well were allowed to attach overnight and subsequently treated with 1 μM PARPi (except PEO1 0.2 μM), SRA737 at indicated dosages (PEO1, PEO1-PR: SRA737 0.2 μM; JHOS4, JHOS4-PR: SRA737 1 μM, OVCAR3 and FUOV1: SRA737 0.5 μM), or combination for 8 h (for γH2AX staining) or 24 h (for phospho-RPA32 (S33) (pRPA32) staining). Untreated cells were used as the Control. After trypsinization and fixation with 4% PFA (Electron Microscopy Sciences, Hatfield, PA) at room temperature for 15 min, cells were centrifuged to remove the PFA and washed with 1×PBS. Cells were treated with blocking buffer composed of PBS containing 2% FBS, 0.01% Tween 20 (Thermo Fisher) and 0.01% Triton X-100 (Thermo Fisher Scientific) for 30 min at room temperature. Cells were stained with γH2AX, pRPA32 or pHH3 diluted in blocking buffer at 1:200 each. After washing with PBS, cells were stained with secondary antibody Goat anti-Rabbit IgG (H + L), conjugated with Alexa Fluor 647 (Thermo Fisher Scientific) for 30 min in the dark at room temperature. Following removal of secondary antibodies, cells were re-suspended in 50 μg/mL Propidium iodide (Sigma-Aldrich, St. Louis, MO) and incubated for 30 min. Samples were then analyzed with the BD LSRII (BD Biosciences, San Jose, CA) flow cytometer and results were analyzed with FlowJo (Tree Star, Inc., Ashland, OR).
Apoptosis detection
Cells were seeded in 6-well plates at 1.5×10⁵ cells/well and treated with indicated dosages of 1 μM PARPi (except PEO 0.2 μM), SRA737, or combination (PEO1, PEO1-PR: SRA737 0.2 μM, 48 h; JHOS4, JHOS4-PR: SRA737 1 μM, 72 h; OVCAR3 and FUOV1: SRA737 0.5 μM, 48 h). Apoptosis detection was performed with eBioscience Annexin V Apoptosis Detection Kit APC (ThermoFisher Scientific). The cells were stained with 5 μL Annexin V-APC and 5 μL PI for 15 min, washed with staining buffer from the kit, and detected with BD LSRII (BD Biosciences, San Jose, CA) flow cytometer. The acquired data was analyzed with FlowJo.
Immunohistochemistry
Tumor tissues were collected and fixed in 10% formalin overnight and then placed in 70% ethanol and put at 4°C. Tissues were dehydrated with degraded ethanol and xylene and embedded in paraffin. Prior to analysis, tissue blocks were cut into 4–6 μm sections and fixed to slides. Slides were then deparaffinized with Histo-Clear, rehydrated with degraded ethanol, and antigen retrieval was performed with 1× target retrieval solution. The endogenous hydrogen peroxidase activity was blocked with hydrogen peroxide for 10 min. Slides were individually stained with primary antibodies pCHK1 (Ser345; Cat. 2348), γH2AX (Cat. 9718), and CyclinE1 (Cat. 20808) (Cell Signaling Technology) at a 1:500 dilution for 60 min. Slides were washed and incubated with horseradish peroxidase conjugated secondary antibodies for 30 min. The slides were then visualized using 3,3′-diaminobenzidine (DAB)+ chromogen for 10 min, washed with water, and counterstained with Eosin. Tissues were dehydrated and mounted with mounting media, then imaged with a Nikon Eclipse 80i or Leica DM 2000 microscope.
After overnight fixation in 10% formalin, tumors were placed in 70% ethanol and provided to WEHI histology services to be paraffin embedded, and for automated IHC to be performed using the Dako Omnis platform (Agilent), with the following antibodies: anti-cyclin E (Cat. 05–363, Merck Millipore), anti-pan cytokeratin (Cat. M3515, Dako), anti-PAX8 (Cat. 10336-1-AP, Proteintech), anti-WT1 (Cat. ab15249, Abcam), anti-p53 (Cat. M700101, Dako) and anti-vimentin (Cat. 5741, Cell Signaling Technology). H&E and IHC slides were scanned digitally using the Pannoramic 1000 scanner (3DHISTECH Ltd.) and high-definition images uploaded into CaseCenter (3DHISTECH Ltd.). Cyclin E IHC was scored by a gynecological pathologist with H-score = (%strong positive x 3) + (%moderate positive x 2) + (%weak positive x 1).
RNA sequencing
PDX tumor pieces were snap frozen at harvest, then RNA was extracted from three independent tumors for each model using an RNeasy Mini Kit (Qiagen) and a Precellys Evolution Touch homogenizer (Bertin Technologies). At least 2ug RNA was submitted for each sample to the Australian Genome Research Facility (Melbourne, Australia). Illumina Stranded mRNA Prep was performed then samples were sequenced on the Novaseq 6000 platform to generate 150 bp PE end reads to 100M depth.
Read alignment was performed using hisat2 (v2.2.1)55,56 with an index built using the human (GRCh38) primary assembly genome (Ensembl release 110) and default settings. BAM files were coordinate sorted using Samtools (v1.9)57 before aligned reads were mapped to exons and quantified using HTseq (v3.0.3).58 Generated counts were then used to create a DGEList object in R (v4.2.2) using the edgeR package (v3.40.2).59 The filterByExpr function with default settings was used to remove lowly expressed genes and normalization factors were calculated using the TMM method.60
Samples were assigned to groups based on their PDX of origin, counts were transformed using the voom function in the limma (v3.54.2) package,61 and a linear model was fit using the lmFit function. To compare responsive versus non-responsive PDX models, the contrasts.fit function was used. PDX #1177 was not included in the analysis due to its outlier status on the MDS plots (plotMDS function in edgeR) being confounded by it being the only OCS sample. The treat function was used to calculate moderated t-statistics with a 0.5 logFC cutoff. Differentially expressed genes were determined using an adjusted p-value <0.05. The glMDPlot function in the Glimma (v2.8.0) package62 was used to generate a two-panel interactive mean-difference (MD) plot. Z-scores calculated from the logCPM values were used to generate a heatmap using hierarchical clustering with the top 200 DE genes using the heatmap.2 function in gplots (v3.1.3).
The Database for Annotation, Visualization, and Integrated Discovery (DAVID v.2023q3: https://david.ncifcrf.gov/)63,64 functional annotation tool was used to interrogate the biological significance of the DE genes identified. Kyoto Encyclopedia of Genes and Genomes (KEGG) pathway enrichment analysis was carried out for both up and down regulated genes with adjusted p-value <0.05. Results were visualized using ggplot2 (v.3.4.4).
Quantification and statistical analysis
Data were analyzed using one-way ANOVA with Dunnett’s multiple comparisons post-hoc test, or two-way ANOVA with Tukey’s multiple comparisons post-hoc test, or unpaired Students T-test. When appropriate, results were reported as mean ± SD or ±SEM (∗, p < 0.05; ∗∗, p < 0.01; ∗∗∗, p < 0.001; ∗∗∗∗, p < 0.0001; GraphPad Prism, La Jolla, CA). For in vivo PDX studies, the longitudinal analysis of tumor growth was carried out by linear mixed-effect modeling with type II ANOVA and pairwise comparisons across groups on log pre-processed tumor sizes using the open access TumGrowth web tool (https://kroemerlab.shinyapps.io/TumGrowth/).65 Log transformed tumor volume was used to better satisfy normal distribution. Survival data was analyzed by Mantel-Cox log-rank test (GraphPad Prism). In vivo synergy score (CDI) was evaluated comparing the slope (S) of each treatment group using the log transformed tumor volume measurements from TumGrowth using the equation ((SCombiantion) + (SVehicle))/((SPARPi) + (SSRA737)). Synergy score of <1 indicates synergy, equal to 1 indicates additivity, and >1 indicates additivity.
Acknowledgments
This work was made possible through funding from NIH (R37-CA-215436, P50-CA-228991, R01-CA-278882, U54-CA-283759), the UPenn Basser Center Team Grant, Penn Ovarian Cancer Translational Center of Excellence, and the Ovarian Cancer Research Center BioTrust awarded to F.S.; The Foundation for Women's Cancer (FWC) St. Louis Ovarian Cancer Awareness and Caring Together Research Grant, UPenn/John Hopkins SPORE pilot grant awarded to H.X.; National Health and Medical Council Australia (1062702), The Stafford Fox Medical Research Foundation, the Cancer Council Victoria Sir Edward Dunlop Fellowship in Cancer Research, and the Victorian Cancer Agency (Clinical Fellowships CRF10–20, CRF16014) awarded to C.L.S. G.H. was supported by a Research Training Program Scholarship provided by the Australian Government Centre for Geomechanics and the University of Melbourne; with additional support from CRC for Cancer Therapeutics. The Australian Ovarian Cancer Study Group was supported by the US Army Medical Research and Materiel Command under DAMD17-01-1-0729, The Cancer Council Victoria, Queensland Cancer Fund, The Cancer Council New South Wales, The Cancer Council South Australia, The Cancer Council Tasmania and The Cancer Foundation of Western Australia (Multi-State Applications 191, 211 and 182) and the National Health and Medical Research Council of Australia (NHMRC; ID199600; ID400413 and ID400281).
The authors thank the Penn Ovarian Cancer Translational Center of Excellence, Ovarian Cancer Research Center, Penn Stem Cell and Xenograft Core for technical support with animal studies and equipment, and University of Pennsylvania Histology cores and Mei Zheng for immunohistochemistry staining. The authors thank Silvia Stoev, Kathy Barber, and Rachel Hancock for technical assistance with the animal studies and the WEHI Bioservices Facility for their support; WEHI Histology and the Center for Dynamic Imaging for IHC staining and analysis. We thank Clovis Oncology for funding FoundationOne assay analysis. The AOCS also acknowledges the cooperation of the participating institutions in Australia and acknowledges the contribution of the study nurses, research assistants and all clinical and scientific collaborators to the study. The complete AOCS Study Group can be found at www.aocstudy.org. We would like to thank all the women who participated in these research programs.
Author contributions
Conceptualization, C.L.S. and F.S.
Methodology, G.Y.H., S.B.G., H.X., C.J.V., S.B., X.W., K.S.A., and M.J.W.
Software, S.B. and M.J.W.
Validation, H.X. and S.B.
Formal Analysis, S.B.G., H.X., C.J.V., S.B., G.R., W.T.H., K.S.A., C.L.S., and F.S.
Investigation, H.X., S.B.G., G.Y.H., S.M., H.K., S.B., Y.K., X.W., C.J.V., C.L.S., and F.S.
Resources, A.O.C.S., R.J.H., B.S., C.L.S., and F.S.
Data Curation, S.B.G., H.X., G.Y.H., S.B., K.S.A., and C.J.V.
Writing – Original Draft, S.B.G., H.X., C.J.V., C.L.S., and F.S.
Writing – Reviewing Editing, H.X., S.B.G., G.Y.H., S.M., K.S.A., H.K., S.B., Y.K., X.W., H.E.B., G.R., W.T.H., R.J.H., B.S., S.M., C.H., M.J.W., C.J.V., C.L.S., and F.S.
Visualization, S.B.G., H.X., and C.J.V.
Supervision, H.E.B., M.J.W., C.J.V., C.L.S., and F.S.
Project Administration, C.L.S. and F.S.
Funding Acquisition, C.L.S. and F.S.
Declaration of interests
F.S. declared scientific advisory board for AstraZeneca, REPARE Therapeutics, GSK, and Zentalis, and Grant/Research support from AstraZeneca for support for clinical trial, and REPARE Therapeutics, Sierra Oncology and support preclinical research. C.L.S. declares Advisory Boards for Sierra Oncology, AstraZeneca, Clovis Oncology, Roche, Eisai Inc, Takeda, MSD, and Illumina, and Grant/Research support from Sierra Oncology, Clovis Oncology, Eisai Inc, Roche, Beigene, AstraZeneca, and Boehringer Ingelheim. B.S., S.M., and C.H. are employees of Sierra Oncology or were employees of Sierra Oncology while they were involved with this work and have stock and/or stock interests in Sierra Oncology. Other authors declare no conflicts of interest.
Published: May 15, 2024
Footnotes
Supplemental information can be found online at https://doi.org/10.1016/j.isci.2024.109978.
Contributor Information
Clare L. Scott, Email: scottc@wehi.edu.au.
Fiona Simpkins, Email: fiona.simpkins@pennmedicine.edu.
Supplemental information
References
- 1.Patch A.M., Christie E.L., Etemadmoghadam D., Garsed D.W., George J., Fereday S., Nones K., Cowin P., Alsop K., Bailey P.J., et al. Whole-genome characterization of chemoresistant ovarian cancer. Nature. 2015;521:489–494. doi: 10.1038/nature14410. [DOI] [PubMed] [Google Scholar]
- 2.Gorski J.W., Ueland F.R., Kolesar J.M. CCNE1 Amplification as a Predictive Biomarker of Chemotherapy Resistance in Epithelial Ovarian Cancer. Diagnostics. 2020;10 doi: 10.3390/diagnostics10050279. [DOI] [PMC free article] [PubMed] [Google Scholar]
- 3.Lheureux S., Oaknin A., Garg S., Bruce J.P., Madariaga A., Dhani N.C., Bowering V., White J., Accardi S., Tan Q., et al. EVOLVE: A Multicenter Open-Label Single-Arm Clinical and Translational Phase II Trial of Cediranib Plus Olaparib for Ovarian Cancer after PARP Inhibition Progression. Clin. Cancer Res. 2020;26:4206–4215. doi: 10.1158/1078-0432.CCR-19-4121. [DOI] [PubMed] [Google Scholar]
- 4.Spruck C.H., Won K.A., Reed S.I. Deregulated cyclin E induces chromosome instability. Nature. 1999;401:297–300. doi: 10.1038/45836. [DOI] [PubMed] [Google Scholar]
- 5.Kok Y.P., Guerrero Llobet S., Schoonen P.M., Everts M., Bhattacharya A., Fehrmann R.S.N., van den Tempel N., van Vugt M.A.T.M. Overexpression of Cyclin E1 or Cdc25A leads to replication stress, mitotic aberrancies, and increased sensitivity to replication checkpoint inhibitors. Oncogenesis. 2020;9:88. doi: 10.1038/s41389-020-00270-2. [DOI] [PMC free article] [PubMed] [Google Scholar]
- 6.Taricani L., Shanahan F., Parry D. Replication stress activates DNA polymerase alpha-associated Chk1. Cell Cycle. 2009;8:482–489. doi: 10.4161/cc.8.3.7661. [DOI] [PubMed] [Google Scholar]
- 7.Lopes M., Cotta-Ramusino C., Pellicioli A., Liberi G., Plevani P., Muzi-Falconi M., Newlon C.S., Foiani M. The DNA replication checkpoint response stabilizes stalled replication forks. Nature. 2001;412:557–561. doi: 10.1038/35087613. [DOI] [PubMed] [Google Scholar]
- 8.Feijoo C., Hall-Jackson C., Wu R., Jenkins D., Leitch J., Gilbert D.M., Smythe C. Activation of mammalian Chk1 during DNA replication arrest: a role for Chk1 in the intra-S phase checkpoint monitoring replication origin firing. J. Cell Biol. 2001;154:913–923. doi: 10.1083/jcb.200104099. [DOI] [PMC free article] [PubMed] [Google Scholar]
- 9.Zachos G., Rainey M.D., Gillespie D.A.F. Chk1-deficient tumour cells are viable but exhibit multiple checkpoint and survival defects. EMBO J. 2003;22:713–723. doi: 10.1093/emboj/cdg060. [DOI] [PMC free article] [PubMed] [Google Scholar]
- 10.Katsuno Y., Suzuki A., Sugimura K., Okumura K., Zineldeen D.H., Shimada M., Niida H., Mizuno T., Hanaoka F., Nakanishi M. Cyclin A-Cdk1 regulates the origin firing program in mammalian cells. Proc. Natl. Acad. Sci. USA. 2009;106:3184–3189. doi: 10.1073/pnas.0809350106. [DOI] [PMC free article] [PubMed] [Google Scholar]
- 11.Cancer Genome Atlas Research Network Integrated genomic analyses of ovarian carcinoma. Nature. 2011;474:609–615. doi: 10.1038/nature10166. [DOI] [PMC free article] [PubMed] [Google Scholar]
- 12.Banerjee S., Moore K.N., Colombo N., Scambia G., Kim B.G., Oaknin A., Friedlander M., Lisyanskaya A., Floquet A., Leary A., et al. Maintenance olaparib for patients with newly diagnosed advanced ovarian cancer and a BRCA mutation (SOLO1/GOG 3004): 5-year follow-up of a randomised, double-blind, placebo-controlled, phase 3 trial. Lancet Oncol. 2021;22:1721–1731. doi: 10.1016/S1470-2045(21)00531-3. [DOI] [PubMed] [Google Scholar]
- 13.Sakai W., Swisher E.M., Karlan B.Y., Agarwal M.K., Higgins J., Friedman C., Villegas E., Jacquemont C., Farrugia D.J., Couch F.J., et al. Secondary mutations as a mechanism of cisplatin resistance in BRCA2-mutated cancers. Nature. 2008;451:1116–1120. doi: 10.1038/nature06633. [DOI] [PMC free article] [PubMed] [Google Scholar]
- 14.Edwards S.L., Brough R., Lord C.J., Natrajan R., Vatcheva R., Levine D.A., Boyd J., Reis-Filho J.S., Ashworth A. Resistance to therapy caused by intragenic deletion in BRCA2. Nature. 2008;451:1111–1115. doi: 10.1038/nature06548. [DOI] [PubMed] [Google Scholar]
- 15.Swisher E.M., Sakai W., Karlan B.Y., Wurz K., Urban N., Taniguchi T. Secondary BRCA1 mutations in BRCA1-mutated ovarian carcinomas with platinum resistance. Cancer Res. 2008;68:2581–2586. doi: 10.1158/0008-5472.CAN-08-0088. [DOI] [PMC free article] [PubMed] [Google Scholar]
- 16.Lin K.K., Harrell M.I., Oza A.M., Oaknin A., Ray-Coquard I., Tinker A.V., Helman E., Radke M.R., Say C., Vo L.T., et al. BRCA Reversion Mutations in Circulating Tumor DNA Predict Primary and Acquired Resistance to the PARP Inhibitor Rucaparib in High-Grade Ovarian Carcinoma. Cancer Discov. 2019;9:210–219. doi: 10.1158/2159-8290.CD-18-0715. [DOI] [PubMed] [Google Scholar]
- 17.Dueva R., Iliakis G. Replication protein A: a multifunctional protein with roles in DNA replication, repair and beyond. NAR Cancer. 2020;2 doi: 10.1093/narcan/zcaa022. [DOI] [PMC free article] [PubMed] [Google Scholar]
- 18.Toledo L.I., Altmeyer M., Rask M.B., Lukas C., Larsen D.H., Povlsen L.K., Bekker-Jensen S., Mailand N., Bartek J., Lukas J. ATR prohibits replication catastrophe by preventing global exhaustion of RPA. Cell. 2013;155:1088–1103. doi: 10.1016/j.cell.2013.10.043. [DOI] [PubMed] [Google Scholar]
- 19.Ashley A.K., Shrivastav M., Nie J., Amerin C., Troksa K., Glanzer J.G., Liu S., Opiyo S.O., Dimitrova D.D., Le P., et al. DNA-PK phosphorylation of RPA32 Ser4/Ser8 regulates replication stress checkpoint activation, fork restart, homologous recombination and mitotic catastrophe. DNA Repair. 2014;21:131–139. doi: 10.1016/j.dnarep.2014.04.008. [DOI] [PMC free article] [PubMed] [Google Scholar]
- 20.Zhao H., Piwnica-Worms H. ATR-mediated checkpoint pathways regulate phosphorylation and activation of human Chk1. Mol. Cell Biol. 2001;21:4129–4139. doi: 10.1128/MCB.21.13.4129-4139.2001. [DOI] [PMC free article] [PubMed] [Google Scholar]
- 21.Macdonald A.G. The homeoviscous theory of adaptation applied to excitable membranes: a critical evaluation. Biochim. Biophys. Acta. 1990;1031:291–310. doi: 10.1016/0304-4157(90)90014-4. [DOI] [PubMed] [Google Scholar]
- 22.Zhao S., Bellone S., Lopez S., Thakral D., Schwab C., English D.P., Black J., Cocco E., Choi J., Zammataro L., et al. Mutational landscape of uterine and ovarian carcinosarcomas implicates histone genes in epithelial-mesenchymal transition. Proc. Natl. Acad. Sci. USA. 2016;113:12238–12243. doi: 10.1073/pnas.1614120113. [DOI] [PMC free article] [PubMed] [Google Scholar]
- 23.Ray-Coquard I., Pautier P., Pignata S., Pérol D., González-Martín A., Berger R., Fujiwara K., Vergote I., Colombo N., Mäenpää J., et al. Olaparib plus Bevacizumab as First-Line Maintenance in Ovarian Cancer. N. Engl. J. Med. 2019;381:2416–2428. doi: 10.1056/NEJMoa1911361. [DOI] [PubMed] [Google Scholar]
- 24.Mitchell C., Park M., Eulitt P., Yang C., Yacoub A., Dent P. Poly(ADP-ribose) polymerase 1 modulates the lethality of CHK1 inhibitors in carcinoma cells. Mol. Pharmacol. 2010;78:909–917. doi: 10.1124/mol.110.067199. [DOI] [PMC free article] [PubMed] [Google Scholar]
- 25.Booth L., Roberts J., Poklepovic A., Dent P. The CHK1 inhibitor SRA737 synergizes with PARP1 inhibitors to kill carcinoma cells. Cancer Biol. Ther. 2018;19:786–796. doi: 10.1080/15384047.2018.1472189. [DOI] [PMC free article] [PubMed] [Google Scholar]
- 26.Nesic K., Kondrashova O., Hurley R.M., McGehee C.D., Vandenberg C.J., Ho G.Y., Lieschke E., Dall G., Bound N., Shield-Artin K., et al. Acquired RAD51C Promoter Methylation Loss Causes PARP Inhibitor Resistance in High-Grade Serous Ovarian Carcinoma. Cancer Res. 2021;81:4709–4722. doi: 10.1158/0008-5472.CAN-21-0774. [DOI] [PMC free article] [PubMed] [Google Scholar]
- 27.Qiu Z., Oleinick N.L., Zhang J. ATR/CHK1 inhibitors and cancer therapy. Radiother. Oncol. 2018;126:450–464. doi: 10.1016/j.radonc.2017.09.043. [DOI] [PMC free article] [PubMed] [Google Scholar]
- 28.da Costa A.A.B.A., Chowdhury D., Shapiro G.I., D'Andrea A.D., Konstantinopoulos P.A. Targeting replication stress in cancer therapy. Nat. Rev. Drug Discov. 2023;22:38–58. doi: 10.1038/s41573-022-00558-5. [DOI] [PMC free article] [PubMed] [Google Scholar]
- 29.Gupta N., Huang T.T., Nair J.R., An D., Zurcher G., Lampert E.J., McCoy A., Cimino-Mathews A., Swisher E.M., Radke M.R., et al. BLM overexpression as a predictive biomarker for CHK1 inhibitor response in PARP inhibitor-resistant BRCA-mutant ovarian cancer. Sci. Transl. Med. 2023;15 doi: 10.1126/scitranslmed.add7872. [DOI] [PMC free article] [PubMed] [Google Scholar]
- 30.Osborne J.D., Matthews T.P., McHardy T., Proisy N., Cheung K.M.J., Lainchbury M., Brown N., Walton M.I., Eve P.D., Boxall K.J., et al. Multiparameter Lead Optimization to Give an Oral Checkpoint Kinase 1 (CHK1) Inhibitor Clinical Candidate: (R)-5-((4-((Morpholin-2-ylmethyl)amino)-5-(trifluoromethyl)pyridin-2-yl)amino)pyrazine-2-carbonitrile (CCT245737) J. Med. Chem. 2016;59:5221–5237. doi: 10.1021/acs.jmedchem.5b01938. [DOI] [PubMed] [Google Scholar]
- 31.Walton M.I., Eve P.D., Hayes A., Henley A.T., Valenti M.R., De Haven Brandon A.K., Box G., Boxall K.J., Tall M., Swales K., et al. The clinical development candidate CCT245737 is an orally active CHK1 inhibitor with preclinical activity in RAS mutant NSCLC and Emicro-MYC driven B-cell lymphoma. Oncotarget. 2016;7:2329–2342. doi: 10.18632/oncotarget.4919. [DOI] [PMC free article] [PubMed] [Google Scholar]
- 32.Kristeleit R., Plummer R., Jones R., Carter L., Blagden S., Sarker D., Arkenau T., Evans T.R.J., Danson S., Symeonides S.N., et al. A Phase 1/2 trial of SRA737 (a Chk1 inhibitor) administered orally in patients with advanced cancer. Br. J. Cancer. 2023;129:38–45. doi: 10.1038/s41416-023-02279-x. [DOI] [PMC free article] [PubMed] [Google Scholar]
- 33.King D., Li X.D., Almeida G.S., Kwok C., Gravells P., Harrison D., Burke S., Hallsworth A., Jamin Y., George S., et al. MYCN expression induces replication stress and sensitivity to PARP inhibition in neuroblastoma. Oncotarget. 2020;11:2141–2159. doi: 10.18632/oncotarget.27329. [DOI] [PMC free article] [PubMed] [Google Scholar]
- 34.Di Giulio S., Colicchia V., Pastorino F., Pedretti F., Fabretti F., Nicolis di Robilant V., Ramponi V., Scafetta G., Moretti M., Licursi V., et al. A combination of PARP and CHK1 inhibitors efficiently antagonizes MYCN-driven tumors. Oncogene. 2021;40:6143–6152. doi: 10.1038/s41388-021-02003-0. [DOI] [PMC free article] [PubMed] [Google Scholar]
- 35.Blosser W.D., Dempsey J.A., McNulty A.M., Rao X., Ebert P.J., Lowery C.D., Iversen P.W., Webster Y.W., Donoho G.P., Gong X., et al. A pan-cancer transcriptome analysis identifies replication fork and innate immunity genes as modifiers of response to the CHK1 inhibitor prexasertib. Oncotarget. 2020;11:216–236. doi: 10.18632/oncotarget.27400. [DOI] [PMC free article] [PubMed] [Google Scholar]
- 36.Heijink A.M., Talens F., Jae L.T., van Gijn S.E., Fehrmann R.S.N., Brummelkamp T.R., van Vugt M.A.T.M. BRCA2 deficiency instigates cGAS-mediated inflammatory signaling and confers sensitivity to tumor necrosis factor-alpha-mediated cytotoxicity. Nat. Commun. 2019;10:100. doi: 10.1038/s41467-018-07927-y. [DOI] [PMC free article] [PubMed] [Google Scholar]
- 37.Bruand M., Barras D., Mina M., Ghisoni E., Morotti M., Lanitis E., Fahr N., Desbuisson M., Grimm A., Zhang H., et al. Cell-autonomous inflammation of BRCA1-deficient ovarian cancers drives both tumor-intrinsic immunoreactivity and immune resistance via STING. Cell Rep. 2021;36 doi: 10.1016/j.celrep.2021.109412. [DOI] [PMC free article] [PubMed] [Google Scholar]
- 38.Plummer E.R., Kristeleit R.S., Cojocaru E., Haris N.M., Carter L., Jones R.H., Blagden S.P., Evans T.J., Arkenau H.-T., Sarker D., et al. A first-in-human phase I/II trial of SRA737 (a Chk1 Inhibitor) in subjects with advanced cancer. J. Clin. Oncol. 2019;37:3094. doi: 10.1200/JCO.2019.37.15_suppl.3094. [DOI] [Google Scholar]
- 39.Jones R., Plummer R., Moreno V., Carter L., Roda D., Garralda E., Kristeleit R., Sarker D., Arkenau T., Roxburgh P., et al. A Phase I/II Trial of Oral SRA737 (a Chk1 Inhibitor) Given in Combination with Low-Dose Gemcitabine in Patients with Advanced Cancer. Clin. Cancer Res. 2023;29:331–340. doi: 10.1158/1078-0432.CCR-22-2074. [DOI] [PMC free article] [PubMed] [Google Scholar]
- 40.Brill E., Yokoyama T., Nair J., Yu M., Ahn Y.R., Lee J.M. Prexasertib, a cell cycle checkpoint kinases 1 and 2 inhibitor, increases in vitro toxicity of PARP inhibition by preventing Rad51 foci formation in BRCA wild type high-grade serous ovarian cancer. Oncotarget. 2017;8:111026–111040. doi: 10.18632/oncotarget.22195. [DOI] [PMC free article] [PubMed] [Google Scholar]
- 41.Kim H., George E., Ragland R., Rafail S., Zhang R., Krepler C., Morgan M., Herlyn M., Brown E., Simpkins F. Targeting the ATR/CHK1 Axis with PARP Inhibition Results in Tumor Regression in BRCA-Mutant Ovarian Cancer Models. Clin. Cancer Res. 2017;23:3097–3108. doi: 10.1158/1078-0432.CCR-16-2273. [DOI] [PMC free article] [PubMed] [Google Scholar]
- 42.Parmar K., Kochupurakkal B.S., Lazaro J.B., Wang Z.C., Palakurthi S., Kirschmeier P.T., Yang C., Sambel L.A., Färkkilä A., Reznichenko E., et al. The CHK1 Inhibitor Prexasertib Exhibits Monotherapy Activity in High-Grade Serous Ovarian Cancer Models and Sensitizes to PARP Inhibition. Clin. Cancer Res. 2019;25:6127–6140. doi: 10.1158/1078-0432.CCR-19-0448. [DOI] [PMC free article] [PubMed] [Google Scholar]
- 43.Kim H., Xu H., George E., Hallberg D., Kumar S., Jagannathan V., Medvedev S., Kinose Y., Devins K., Verma P., et al. Combining PARP with ATR inhibition overcomes PARP inhibitor and platinum resistance in ovarian cancer models. Nat. Commun. 2020;11:3726. doi: 10.1038/s41467-020-17127-2. [DOI] [PMC free article] [PubMed] [Google Scholar]
- 44.Serra V., Wang A.T., Castroviejo-Bermejo M., Polanska U.M., Palafox M., Herencia-Ropero A., Jones G.N., Lai Z., Armenia J., Michopoulos F., et al. Identification of a Molecularly-Defined Subset of Breast and Ovarian Cancer Models that Respond to WEE1 or ATR Inhibition, Overcoming PARP Inhibitor Resistance. Clin. Cancer Res. 2022;28:4536–4550. doi: 10.1158/1078-0432.CCR-22-0568. [DOI] [PMC free article] [PubMed] [Google Scholar]
- 45.Lappalainen I., Almeida-King J., Kumanduri V., Senf A., Spalding J.D., ur-Rehman S., Saunders G., Kandasamy J., Caccamo M., Leinonen R., et al. The European Genome-phenome Archive of human data consented for biomedical research. Nat. Genet. 2015;47:692–695. doi: 10.1038/ng.3312. [DOI] [PMC free article] [PubMed] [Google Scholar]
- 46.George E., Kim H., Krepler C., Wenz B., Makvandi M., Tanyi J.L., Brown E., Zhang R., Brafford P., Jean S., et al. A patient-derived-xenograft platform to study BRCA-deficient ovarian cancers. JCI Insight. 2017;2 doi: 10.1172/jci.insight.89760. [DOI] [PMC free article] [PubMed] [Google Scholar]
- 47.Gitto S.B., George E., Medvedev S., Simpkins F., Powell D.J., Jr. Humanized Patient-Derived Xenograft Models of Ovarian Cancer. Methods Mol. Biol. 2022;2424:255–274. doi: 10.1007/978-1-0716-1956-8_17. [DOI] [PubMed] [Google Scholar]
- 48.Topp M.D., Hartley L., Cook M., Heong V., Boehm E., McShane L., Pyman J., McNally O., Ananda S., Harrell M., et al. Molecular correlates of platinum response in human high-grade serous ovarian cancer patient-derived xenografts. Mol. Oncol. 2014;8:656–668. doi: 10.1016/j.molonc.2014.01.008. [DOI] [PMC free article] [PubMed] [Google Scholar]
- 49.Marks Z.R.C., Campbell N.K., Mangan N.E., Vandenberg C.J., Gearing L.J., Matthews A.Y., Gould J.A., Tate M.D., Wray-McCann G., Ying L., et al. Interferon-epsilon is a tumour suppressor and restricts ovarian cancer. Nature. 2023;620:1063–1070. doi: 10.1038/s41586-023-06421-w. [DOI] [PubMed] [Google Scholar]
- 50.Kondrashova O., Topp M., Nesic K., Lieschke E., Ho G.Y., Harrell M.I., Zapparoli G.V., Hadley A., Holian R., Boehm E., et al. Methylation of all BRCA1 copies predicts response to the PARP inhibitor rucaparib in ovarian carcinoma. Nat. Commun. 2018;9:3970. doi: 10.1038/s41467-018-05564-z. [DOI] [PMC free article] [PubMed] [Google Scholar]
- 51.Nesic K., Krais J.J., Vandenberg C.J., Wang Y., Patel P., Cai K.Q., Kwan T., Lieschke E., Ho G.Y., Barker H.E., et al. BRCA1 secondary splice-site mutations drive exon-skipping and PARP inhibitor resistance. medRxiv. 2023 doi: 10.1101/2023.03.20.23287465. Preprint at. [DOI] [Google Scholar]
- 52.Ho G.Y., Kyran E.L., Bedo J., Wakefield M.J., Ennis D.P., Mirza H.B., Vandenberg C.J., Lieschke E., Farrell A., Hadla A., et al. Epithelial-to-mesenchymal transition supports ovarian carcinosarcoma tumorigenesis and confers sensitivity to microtubule-targeting with eribulin. Cancer Res. 2022;82:4457–4473. doi: 10.1158/0008-5472.CAN-21-4012. [DOI] [PMC free article] [PubMed] [Google Scholar]
- 53.Schneider C.A., Rasband W.S., Eliceiri K.W. NIH Image to ImageJ: 25 years of image analysis. Nat. Methods. 2012;9:671–675. doi: 10.1038/nmeth.2089. [DOI] [PMC free article] [PubMed] [Google Scholar]
- 54.Ianevski A., Giri A.K., Aittokallio T. SynergyFinder 3.0: an interactive analysis and consensus interpretation of multi-drug synergies across multiple samples. Nucleic Acids Res. 2022;50:W739–W743. doi: 10.1093/nar/gkac382. [DOI] [PMC free article] [PubMed] [Google Scholar]
- 55.Kim D., Langmead B., Salzberg S.L. HISAT: a fast spliced aligner with low memory requirements. Nat. Methods. 2015;12:357–360. doi: 10.1038/nmeth.3317. [DOI] [PMC free article] [PubMed] [Google Scholar]
- 56.Kim D., Paggi J.M., Park C., Bennett C., Salzberg S.L. Graph-based genome alignment and genotyping with HISAT2 and HISAT-genotype. Nat. Biotechnol. 2019;37:907–915. doi: 10.1038/s41587-019-0201-4. [DOI] [PMC free article] [PubMed] [Google Scholar]
- 57.Li H., Handsaker B., Wysoker A., Fennell T., Ruan J., Homer N., Marth G., Abecasis G., Durbin R., 1000 Genome Project Data Processing Subgroup The Sequence Alignment/Map format and SAMtools. Bioinformatics. 2009;25:2078–2079. doi: 10.1093/bioinformatics/btp352. [DOI] [PMC free article] [PubMed] [Google Scholar]
- 58.Anders S., Pyl P.T., Huber W. HTSeq--a Python framework to work with high-throughput sequencing data. Bioinformatics. 2015;31:166–169. doi: 10.1093/bioinformatics/btu638. [DOI] [PMC free article] [PubMed] [Google Scholar]
- 59.Robinson M.D., McCarthy D.J., Smyth G.K. edgeR: a Bioconductor package for differential expression analysis of digital gene expression data. Bioinformatics. 2010;26:139–140. doi: 10.1093/bioinformatics/btp616. [DOI] [PMC free article] [PubMed] [Google Scholar]
- 60.Robinson M.D., Oshlack A. A scaling normalization method for differential expression analysis of RNA-seq data. Genome Biol. 2010;11:R25. doi: 10.1186/gb-2010-11-3-r25. [DOI] [PMC free article] [PubMed] [Google Scholar]
- 61.Ritchie M.E., Phipson B., Wu D., Hu Y., Law C.W., Shi W., Smyth G.K. limma powers differential expression analyses for RNA-sequencing and microarray studies. Nucleic Acids Res. 2015;43:e47. doi: 10.1093/nar/gkv007. [DOI] [PMC free article] [PubMed] [Google Scholar]
- 62.Su S., Law C.W., Ah-Cann C., Asselin-Labat M.L., Blewitt M.E., Ritchie M.E. Glimma: interactive graphics for gene expression analysis. Bioinformatics. 2017;33:2050–2052. doi: 10.1093/bioinformatics/btx094. [DOI] [PMC free article] [PubMed] [Google Scholar]
- 63.Huang D.W., Sherman B.T., Lempicki R.A. Systematic and integrative analysis of large gene lists using DAVID bioinformatics resources. Nat. Protoc. 2009;4:44–57. doi: 10.1038/nprot.2008.211. [DOI] [PubMed] [Google Scholar]
- 64.Huang D.W., Sherman B.T., Lempicki R.A. Bioinformatics enrichment tools: paths toward the comprehensive functional analysis of large gene lists. Nucleic Acids Res. 2009;37:1–13. doi: 10.1093/nar/gkn923. [DOI] [PMC free article] [PubMed] [Google Scholar]
- 65.Enot D.P., Vacchelli E., Jacquelot N., Zitvogel L., Kroemer G. TumGrowth: An open-access web tool for the statistical analysis of tumor growth curves. OncoImmunology. 2018;7 doi: 10.1080/2162402X.2018.1462431. [DOI] [PMC free article] [PubMed] [Google Scholar]
Associated Data
This section collects any data citations, data availability statements, or supplementary materials included in this article.
Supplementary Materials
Data Availability Statement
The following datasets have been deposited in the European Genome-Phenome Archive (EGA), which is hosted by the EBI and the CRG, under accession number EGAS50000000084: RNAseq fastq files for PDX samples: #111, #1177, #201, #206, #29, #931, #WO-19, #WO-2. A data transfer agreement is required. Further information about EGA can be found on https://ega-archive.org "The European Genome-phenome Archive of human data consented for biomedical research".45 Original code used for RNAseq analysis has been deposited in Zenodo with https://doi.org/10.5281/zenodo.10511675. Other data or any additional information required to reanalyze the data reported in this paper is available from the lead contact upon request.