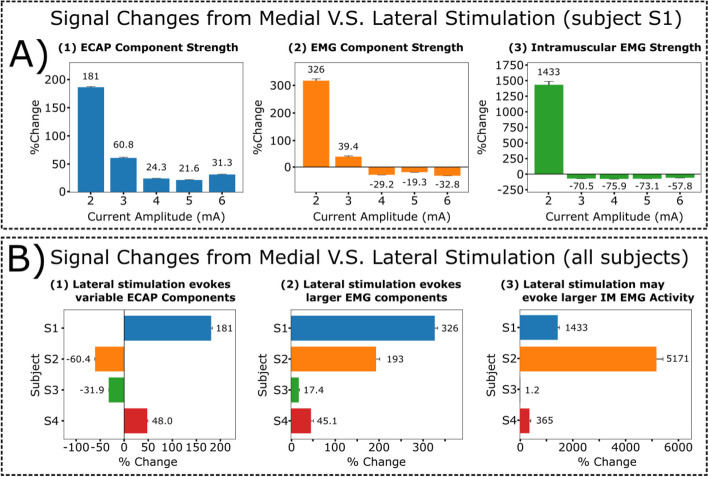
Fig. 7.
Quantification for recorded ESR components and intramuscular EMG recordings after lateral displacement of the stimulation lead. Motor thresholds for the medial lead position of all subjects (n=4) were verified within intramuscular EMG recordings and as follows: S1: 2.0 mA; S2: 6.0 mA; S3: 2.0 mA; S4: 2.9 mA. RMS was calculated for the ECAP (time window: 1-2.5 ms) and EMG (time window: 3-13 ms) components of the recorded ESRs and intramuscular EMG (IM, time window: 3-13 ms). A Data from respective subject S1 show signal strength change when stimulation moved from medial to lateral positions across multiple stimulation amplitudes for collected ESRs, shown as (1) ECAP (2.0 mA: 181 ± 2.72%; 3.0 mA: 60.8 ± 1.18%; 4.0 mA: 24.3 ± 0.33%; 5.0 mA: 21.6 ± 0.38%; 6.0 mA: 31.34 ± 0.45%) and (2) EMG components (2.0 mA: 326 ± 6.89%; 3.0 mA: 39.4 ± 2.37%; 4.0 mA: -29.2 ± 0.46%; 5.0 mA: -19.3 ± 0.69%; 6.0 mA: -32.8 ± 0.50%), and (3) intramuscular EMG (IM) recordings (2.0 mA: 1433 ± 54.0%; 3.0 mA: -70.5 ± 0.62%; 4.0 mA: -75.9 ± 0.31%; 5.0 mA: -73.1 ± 0.36%; 6.0 mA: -57.8 ± 0.74%). B Changes to signal strength were observed at motor thresholds for all subjects for recorded ESRs, including (1) ECAP (S1: 181 ± 2.72%; S2: -60.4 ± 0.20%; S3: -31.9 ± 0.10%; S4: 48.0 ± 1.20%) and (2) EMG components (S1: 327 ± 6.90%; S2: 193 ± 8.20%; S3: 17.4 ± 2.00%; S4: 45.1 ± 5.50%) and (3) intramuscular EMG (IM) recordings (S1: 1433 ± 54.0%; S2: 5171 ± 237%; S3: 1.20 ± 0.79%; S4: 365 ± 38.9%). Additional plots for subject comparisons containing RMS values are provided in Supplementary Fig. 9

