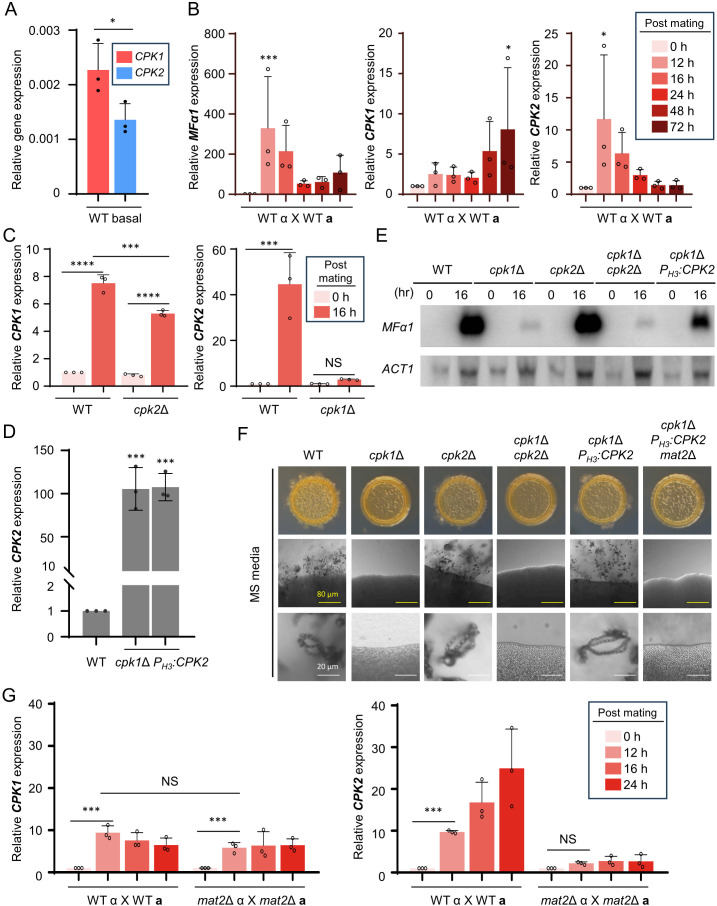
Fig 2.
Cpk2 operates as a functional paralog to Cpk1 in C. neoformans. (A) The expression level of CPK1 and CPK2 was quantified relative to that of ACT1 using a quantitative reverse transcription-PCR (qRT-PCR) assay in a pre-mating wild-type sample. (B) In C. neoformans serotype A, MATα and MATa wild-type strains underwent bisexual mating (H99 × YL99a) in V8 medium at room temperature in the dark. After 0, 12, 16, 24, 48, and 72 h post-mating, expression levels of MFα1, CPK1, and CPK2 were analyzed through qRT-PCR. (C) After unilateral mating of wild-type (H99 × YL99a) and cpk1Δ (cpk1Δ MATα × YL99a) strains, cells were collected at the specified time points. RNA from these cells was used to determine CPK2 expression via qRT-PCR. Similarly, following mating with wild-type and cpk2Δ (cpk2Δ MATα × YL99a) strains, CPK1 expression was assessed. (D) CPK2 expression was quantified in the wild-type (H99) and cpk1Δ PH3:CPK2 (YSB9414 and YSB9419) strains. Validation involved three independent qRT-PCR assays. (E) YL99a, along with H99 and MATα mutant strains—cpk1Δ (YSB127), cpk2Δ (YSB373), cpk1Δ cpk2Δ (YSB8126), and cpk1Δ PH3:CPK2 (YSB9414)—were cultivated. After 16 h post-mating, cells were harvested and subjected to RNA extraction. The expression of MFα1 was measured via northern blot analysis. Post-analysis, the membrane was reprobed to measure actin gene (ACT1) expression. (F) YL99a, alongside H99 and knockout mutants cpk1Δ, cpk2Δ, cpk1Δ PH3:CPK2, and cpk1Δ PH3:CPK2 mat2Δ (YSB10284), were cultured. Equal proportions of MATα and MATa wild-type cells were co-spotted on MS (Murashige and Skoog) media. After 11 days, morphological changes, including colony morphology, filamentation, and sporulation, were documented. (G) Wild-type (H99 and YL99a) and mat2Δ [mat2Δ MATα (YSB10585) and mat2Δ MATa (YSB10577)] strains were cultivated and plated on V8 media for bilateral mating. After 0, 12, 16, and 24 h post-mating, cells were harvested, RNA was extracted, and expression levels of CPK1 and CPK2 were determined through qRT-PCR. The data represent three biological and three technical repetitions. Statistical analysis was conducted using one-way analysis of variance (ANOVA) with Tukey’s test: *, P < 0.05; **, P < 0.01; ***, P < 0.001; ****, P < 0.0001; NS = not significant.

