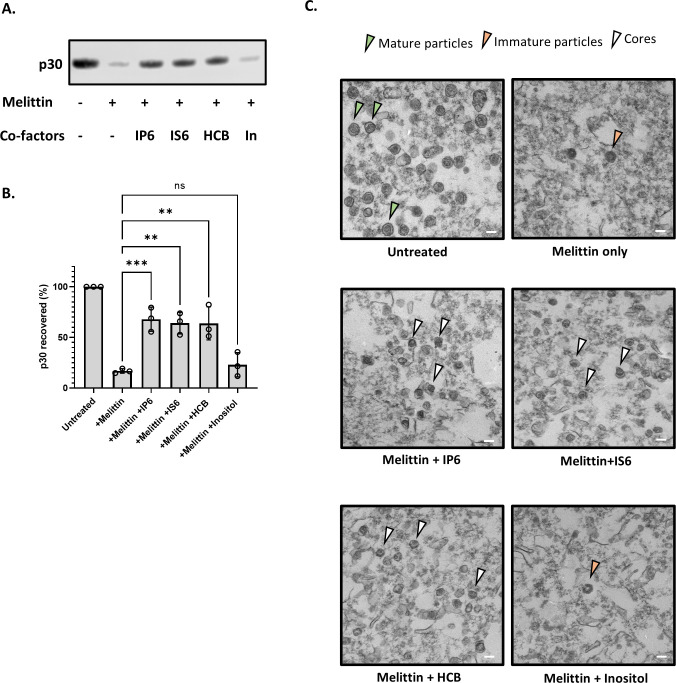
Fig 2.
Cyclic polyanions stabilize MLV cores. (A) Representative immunoblot probed for MLV capsid protein (P30) in viral pellets in the presence and absence of co-factors (indicated below the blot). The concentration of melittin is 12.5 µg/mL and the small molecules are used at a concentration of 80 µM. (B) The bar graph shows the quantification of the percentage p30CA recovery after the addition of co-factors. The graph represents the mean ± SD from three independent experiments. Statistical significance is analyzed using one-way ANOVA. P values are indicated by *, ***P < 0.001, **P < 0.01, ns: not significant. (C) Electron micrographs of MLV before and after treatment with co-factors (indicated below each micrograph). The green arrowhead points to mature MLV particles, the orange arrowhead points to immature particles, and the white arrowhead points to intact MLV cores. The scale bar is 100 nm.

