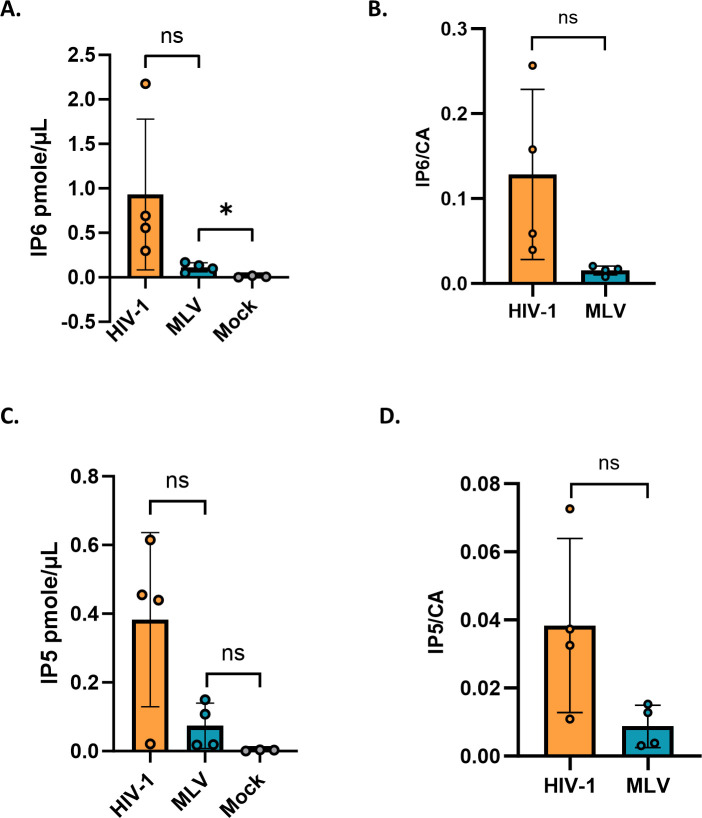
Fig 3.
MLV packages IP5/6. The bar graph shows the absolute amount in pmole/µL of (A) IP6 and (C) IP5 packaged in HIV-1 and MLV. Mock represents supernatant from cells transfected with empty vector control. The amounts of (B) IP6 and (D) IP5 in HIV-1 and MLV are normalized to the respective capsid protein levels in each virus. The graphs represent the mean ± SD of four independent experiments. Statistical significance is analyzed using Student’s t test. P values are indicated by *, **P < 0.01, *P < 0.05, ns: not significant.

