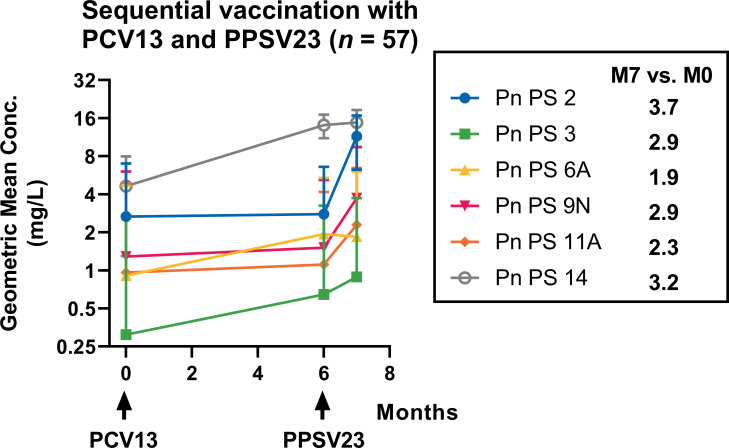
Fig 3.
Concentrations of serotype-specific pneumococcal antibodies in 57 plaque psoriasis patients were tracked over the course of 7 months after their first vaccination. The patients’ antibody levels were measured before their first vaccination with PCV13 (M0), before their second vaccination with PPSV23 (M6), and at month 7 after the first vaccination, i.e., month 1 after the second vaccination (M7). The results are presented as the geometric mean concentration and geometric standard deviation factor, and the time of vaccination is marked with an arrow.

