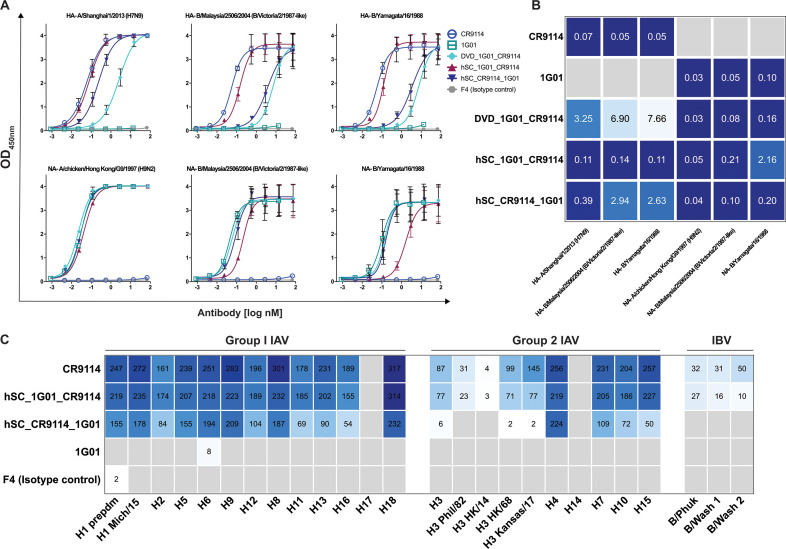
Fig 2.
Reactivity profiles of bsAbs. (A) ELISA curves of mAbs and bsAbs against HA and NA antigens. (B) EC50 values (in nM) derived from curve fitting, with stronger reactivity (lower EC50) denoted as darker blue. (C) Microarray reactivities (area under the curve, AUC) of mAbs and bsAbs toward group 1 and 2 IAV, as well as IBV HAs (a full list of protein names is included in Table S3). Reactivity values are shown, with darker blue indicating stronger reactivity. Gray squares indicate no reactivity.

