
Fig. 1 |. Vancomycin resistance is enhanced by propionate or vitamin B12 supplementation and is predictive of PDIM production in Mtb.
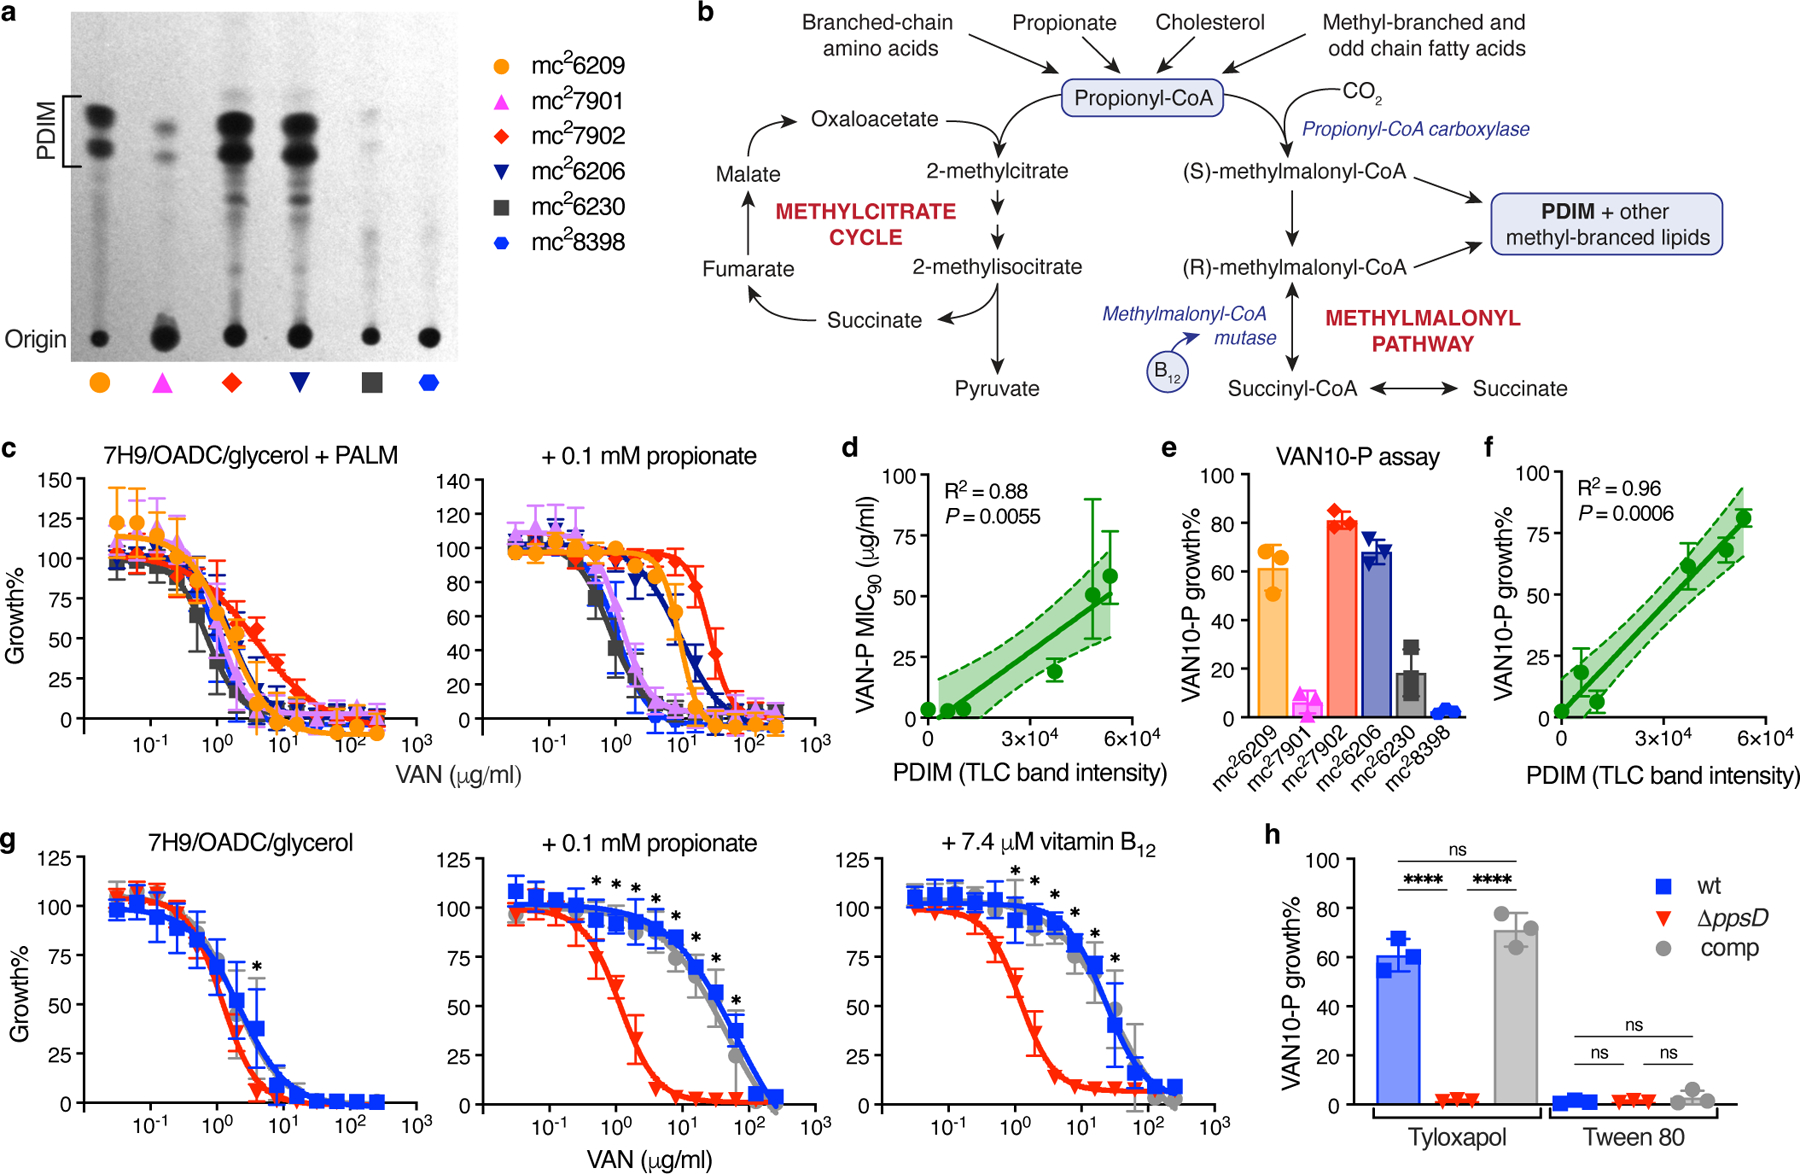
a, TLC lipid analysis of the PDIM reference strain set (see Supplementary Table 1). b, Metabolic pathways of methylmalonyl-CoA production and propionyl-CoA catabolism. c, Vancomycin resistance of the Mtb PDIM reference strain set in 7H9/OADC/glycerol/tyloxapol + PALM (pantothenate, arginine, leucine, and methionine) media, and additionally supplemented with 0.1 mM propionate (‘VAN-P’ MIC), measured after 7 days incubation. d, Correlation between VAN-P MIC90 from the curve fit in (c) (+ 0.1 mM propionate) and PDIM band intensity from (a). The solid line indicates the linear regression best-fit, and the error bands the 95% CI. e, ‘VAN10-P’ assay comparing growth in 10 μg/ml vancomycin with 0.1 mM propionate to drug-free controls (VAN10 OD / VAN0 OD × 100 = VAN10-P growth%). f, Correlation between VAN10-P growth% from (e) and PDIM from (a). The solid line indicates the linear regression best-fit, and the error bands the 95% CI. g, Vancomycin resistance of PDIM(+) and PDIM(-) Mtb H37Rv strains in standard 7H9/OADC/glycerol/tyloxapol media and supplemented with 0.1 mM propionate or 7.4 μM vitamin B12 (10 μg/ml). *P < 0.001 for both wt and comp versus ΔppsD; two-way ANOVA with Tukey’s multiple comparison test. h, VAN10-P assay of H37Rv strains with tyloxapol or Tween 80. ****P < 0.0001; one-way ANOVA with Tukey’s multiple comparison test. MIC data show mean ± SD for n = 4 biological replicates from two independent experiments. VAN10-P data show mean ± SD for n = 3 three independent experiments, each performed in triplicate.