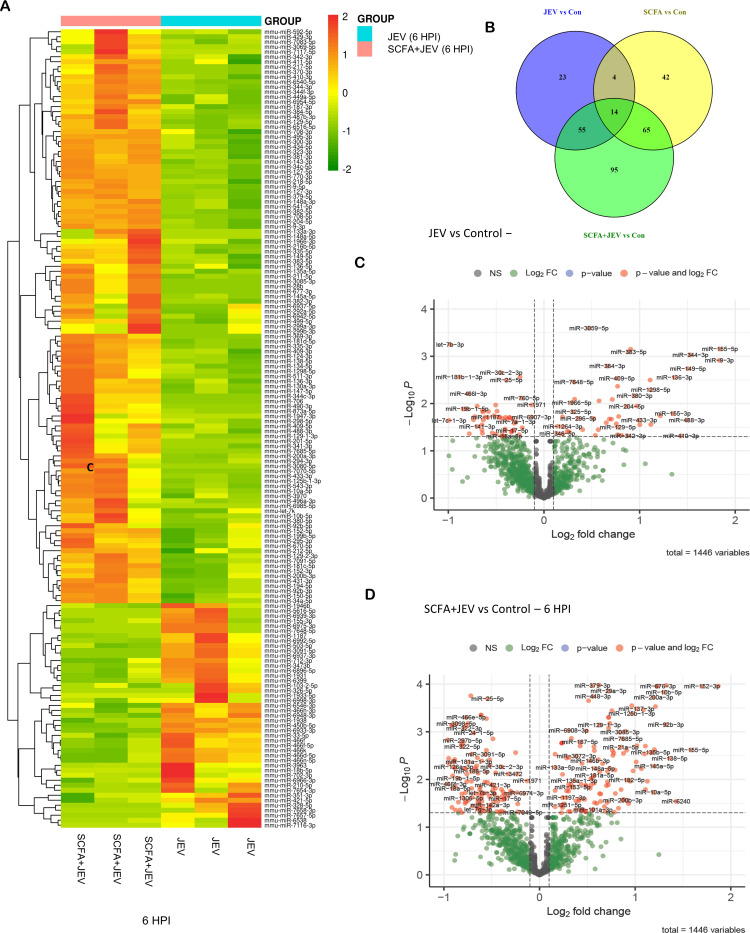
Fig 3.
Differential expression analysis of microRNAs post SCFA pretreatment and/or JEV infection. Small RNA sequencing was performed post SCFA pretreatment and JEV infection at multipicity of infection (MOI) 3. (A) Represents heat map depicting differentially expressed microRNAs in JEV group and SCFA + JEV group 6 HPI. (B) Venn diagram showing the number of miRNAs differentially expressed across different conditions. (C) Volcano plot showing the differentially expressed miRNAs in JEV group versus control group. (D) Volcano plot showing the differentially expressed miRNAs in SCFA + JEV group versus control group.

