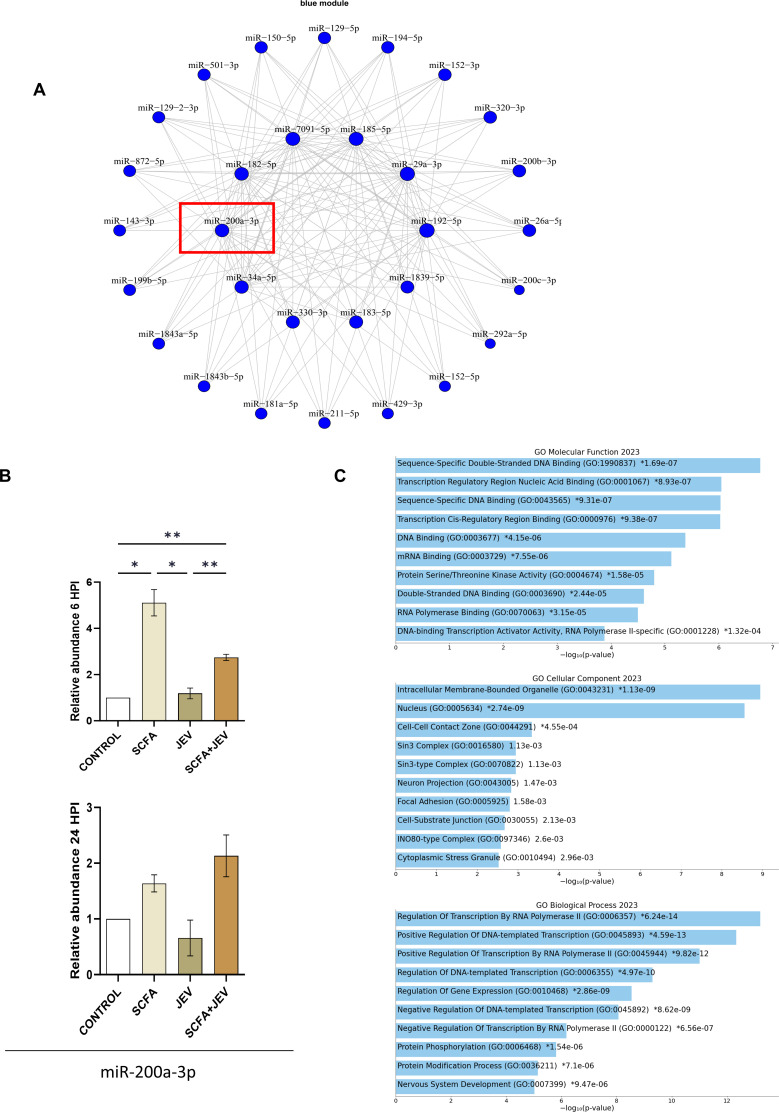
Fig 4.
WGCNA revealed a network of miRNAs (blue module) significantly upregulated in SCFA conditions. (A) Represents the cluster of microRNAs color coded as the blue module that showed significant upregulation in SCFA conditions. (B) Bar graphs showing microRNA-200a-3p expression changes across all conditions at 6 HPI and 24 HPI. Data represented as mean fold change ± SEM with respect to control from a minimum of three independent experiments. P-values were determined (*, P < 0.05; **, P < 0.01; ***, P < 0.001) using one-way analysis of variance followed by Tukey’s post hoc correction. (C) Gene Ontology (GO) analysis graphs representing functional enrichment of the blue module at biological process, cellular component, and molecular function levels.

