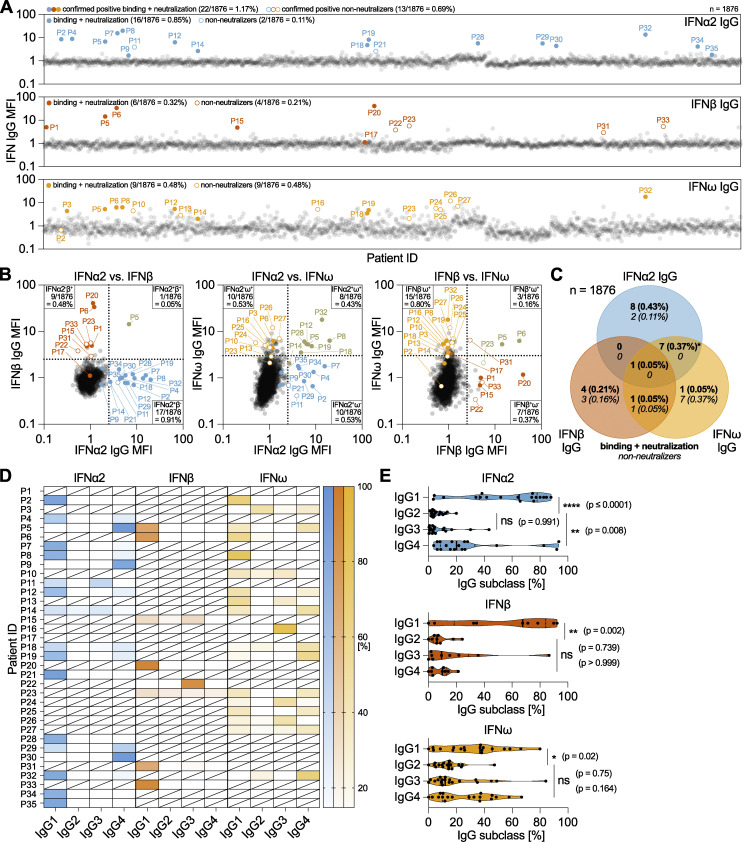
Figure 1.
Identification and characterization of anti-IFN-I autoAbs in a longitudinally sampled infectious disease patient cohort. (A–C) Validated screening results for the presence of anti-IFNα2, anti-IFNβ, and anti-IFNω IgG in plasma samples derived from unique patients enrolled in the SHCS and aged >65 years at the time of sampling (n = 1,876, representative of two independent screenings). MFI fold change (FC) of IgG values obtained from IFN-I–coated beads relative to the MFI of IgG values obtained from empty beads is shown, normalized to the cohort means for each IFN-I. All individual patient sample results from the initial screening are shown (circles), but only patients considered positive after secondary analysis of longitudinal samples are colored (see Materials and methods for thresholds). Solid-colored circles represent patients who also neutralized the respective IFN-I in subsequent assays. Numbers and percentages of positive patients (neutralizing and non-neutralizing IgG) are indicated for each anti-IFN-I IgG. (B) Pairwise representation of the data shown in A comparing the indicated combinations of anti-IFNα2, anti-IFNβ, and anti-IFNω IgG found in each patient. (C) Venn diagram analysis of the 35 anti-IFN-I autoAb-positive patients highlighting the anti-IFN-I autoAb specificities observed for neutralizing and non-neutralizing IgG. Percentages refer to the entire subcohort (n = 1,876). The asterisk denotes the inclusion of a single patient found to possess binding and neutralizing anti-IFNα2 IgG, as well as binding and non-neutralizing anti-IFNω IgG. (D and E) Plasma samples from anti-IFN-I autoAb-positive patients were analyzed to determine relative levels (%) of each of the four IgG subclasses targeting IFN-Is (n = 33 patients, with at least two independent samples tested per patient). (D) Patient-level analysis is shown as a heat map, where white blocks indicate no anti-IFN-I IgG subclass was detected, and slashed blocks indicate IgG subclass was not determined. (E) IgG subclass analysis in all patients for each IFN-I. Statistical analysis was performed using a one-way ANOVA with Tukey’s multiple comparison (single pooled variance). Exact P values are stated in the panel (* = significant; ns = non-significant).

