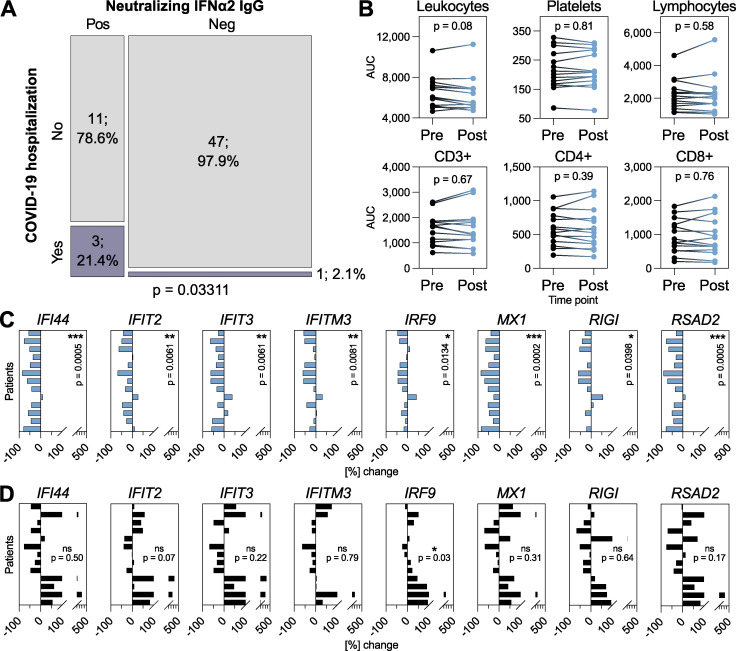
Figure 3.
Neutralizing anti-IFNα2 autoAbs are associated with subsequent COVID-19 hospitalization and with compromised baseline ISG levels. (A) Mosaic plot comparing the SHCS recorded incidence of COVID-19 hospitalization between patients who developed neutralizing anti-IFNα2 autoAbs (n = 14) and matched control patients who did not (n = 48). Only patients who were still actively enrolled in the SHCS in 2020 were included (therefore n differs from that in Table S2). Statistical analysis was performed using Fisher’s exact test for count data, and the exact P value is indicated in the panel. (B) Area under the curve (AUC) values for clinically determined cell compositions in whole blood (as indicated) in patients who developed neutralizing anti-IFNα2 autoAbs. Existing clinical cell titers were obtained for each patient from the SHCS, and AUC values were determined from all available data up to 1 year before (pre) or 1 year after (post) the time point where anti-IFNα2 autoAbs were first detected (n = 16). Statistical analysis was performed using a paired Wilcoxon signed rank test. Exact P values are indicated in the panel. (C and D) RT-qPCR analysis of the indicated ISGs in PBMCs from patients who developed neutralizing anti-IFNα autoAbs (n = 13, two to three independent samples per time point) (C) or age-matched control patients who never developed anti-IFN-I autoAbs (n = 13, two to three independent samples per time point) (D). Data shown for each patient represent mean percentage changes in expression of the indicated ISG relative to the first time point (i.e., samples taken before the development of anti-IFNα autoAbs for C, or to the equivalent time point for D). The statistical significance of changes across all patients was determined based on the original ΔCt values (normalized to GAPDH) using a Mann–Whitney U test. Exact P values are indicated in the panels (* = significant; ns = non-significant).

