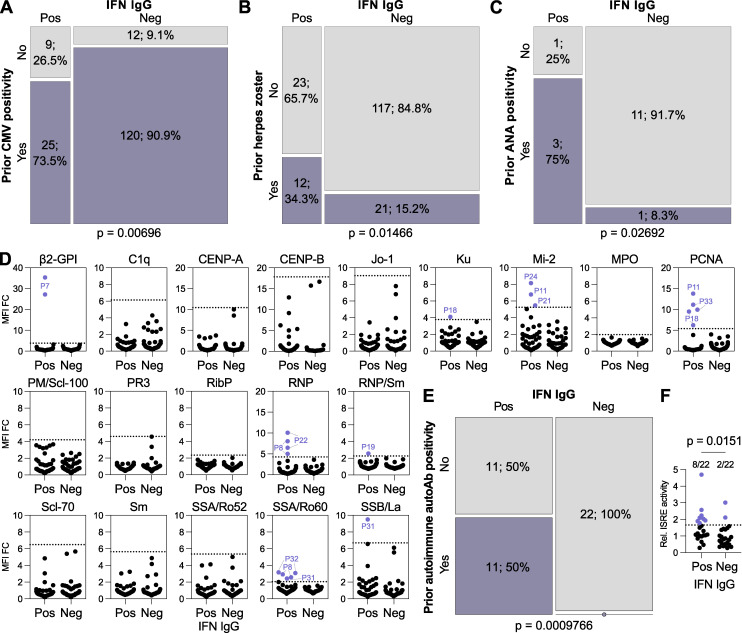
Figure 4.
Prior infections and immune factors influence the development of anti-IFN-I autoAbs. (A–C) Mosaic plots comparing the SHCS recorded incidence of prior CMV positivity (A), prior herpes zoster diagnosis (B), or prior ANA test positivity (C) between patients who developed anti-IFN-I autoAbs and matched control patients who did not. In A and B, only patients with complete data for the indicated parameter were included (therefore n differs slightly from that in Table S3). In C, only patients who were tested are included. For all panels, n and % are shown. (D) Screening results for the presence of 19 different anti-autoantigen IgGs in plasma samples derived from anti-IFN-I autoAb positive (Pos) patients (n = 22 patients, with two independent samples tested per patient) and age-matched negative control (Neg) patients (n = 22 patients, with two independent samples tested per patient) who were confirmed to have never developed anti-IFN-I autoAbs. The two samples tested per patient were the two samples immediately preceding the first detection of anti-IFN-I autoAbs (for the positive patients; typically 6 and 12 mo before) or age-matched time points for the negative patients. MFI FC IgG values obtained from the indicated autoantigen-coated beads are shown relative to the MFI of IgG values obtained from empty beads normalized to the negative patient mean for each autoantigen. All patient samples are shown (circles). Patient plasmas exhibiting normalized MFI values >5 SDs above the mean MFIs obtained from the negative patient samples (dotted lines) were considered positive for the specific anti-autoantigen IgG and were colored and labeled. (E) Mosaic plot analysis of the data in D. (F) Average relative ISRE-driven luciferase (Luc) activity induced by the two plasma samples from each patient described in D (Pos, n = 22; Neg, n = 22). For A and B, statistical analyses were performed using conditional-logistic regression (taking into account the matched nature of the data) and likelihood-ratio tests; for C, statistical analysis was performed using Fisher’s exact test for count data (as the routine ANA data were not available for matched pairs of cases and controls); and for E, statistical analysis was performed using the exact McNemar test (as this takes into account both the paired nature of the data and the absence of events in one group). For F, statistical analysis was performed using a Mann–Whitney U test. Exact P values are indicated in the appropriate panel.

