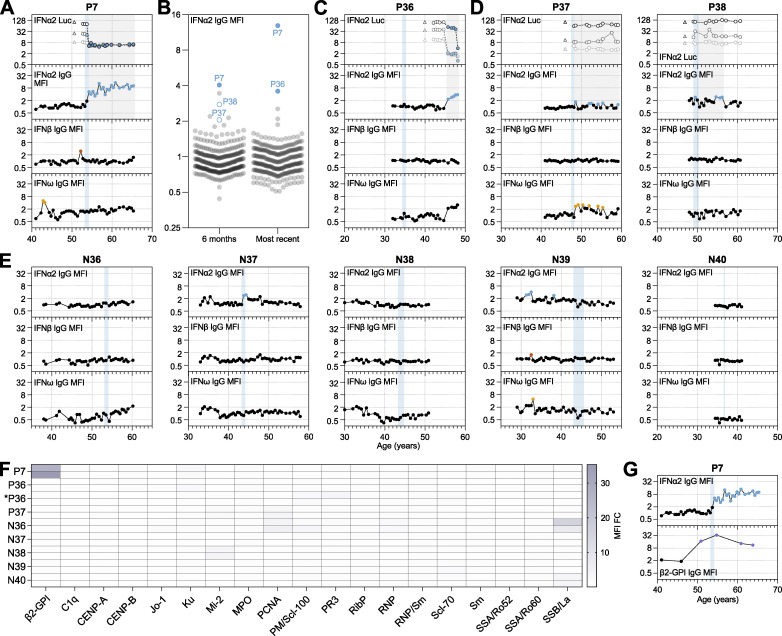
Figure 5.
Therapeutic IFNα likely triggered the development and lifelong persistence of neutralizing anti-IFNα autoAbs in an individual with pre-existing autoimmunity. (A) Representation of anti-IFNα2, anti-IFNβ, and anti-IFNω IgG levels (MFI FC), as well as IFNα2 neutralization (inhibition of IFN-induced luciferase [Luc] activity) at three different doses (see Materials and methods), for all available longitudinal samples from patient P7 (who was treated therapeutically with IFNα2) plotted as a function of patient age (years). Each sample was tested in duplicate, and selected samples were retested for independent experimental validation. (B) Validated screening results for the presence of anti-IFNα2 IgG in plasma samples derived from unique patients enrolled in the SHCS who were treated with IFNα2 (n = 300). Two independent samples per patient were assayed in duplicate: the first sample available after IFNα treatment (typically around 6 mo), and the last sample available (most recent: typically 10–20 years later). MFI FC values obtained from IFNα2-coated beads relative to the MFI of values obtained from empty beads are shown, normalized to the cohort mean. All individual patient samples are shown (circles), with samples considered positive after subsequent independent analysis of longitudinal samples colored (see Materials and methods for thresholds). Solid colored circles represent plasma samples that also neutralized IFNα when assayed. Positive patient samples are labeled. (C–E) Representation of data similar to A, but for all available longitudinal samples from the indicated patients who had also been treated therapeutically with IFNα2. Each sample was tested in duplicate, and selected samples were retested for independent experimental validation. (F) Heatmap representation of screening results for the presence of 19 different anti-autoantigen IgGs in plasma samples derived from several patients who had been treated therapeutically with IFNα2 (n = 8). Two independent samples per patient were tested, which were the two samples immediately preceding the start of IFNα2 treatment (typically 6 and 12 mo before), as well as immediately preceding first detection of anti-IFN-I autoAbs (for newly identified patient *P36). MFI FC IgG values obtained from the indicated autoantigen-coated beads are shown relative to the MFI of IgG values obtained from empty beads normalized to the means of controls shown in Fig. 4. Patient plasmas exhibiting normalized MFI values >5 SDs above the mean MFIs obtained from the controls shown in Fig. 4 were considered positive for the specific anti-autoantigen IgG and are colored. Note that the samples for P7 are the same as shown in Fig. 4, as the start of IFNα2 treatment coincided with the first detection of anti-IFN-I autoAbs. (G) Representation of anti-IFNα2 (from A) and anti-β2-GPI IgG levels (MFI FC), in selected longitudinal samples from patient P7 plotted as a function of patient age (years). Each sample was tested in duplicate. In A–E and G, colored circles represent samples considered positive for either binding IgG or neutralization (see Materials and methods for thresholds). Triangles in neutralization plots represent negative controls. Blue shading indicates the period of time when each patient underwent IFNα2 treatment.

