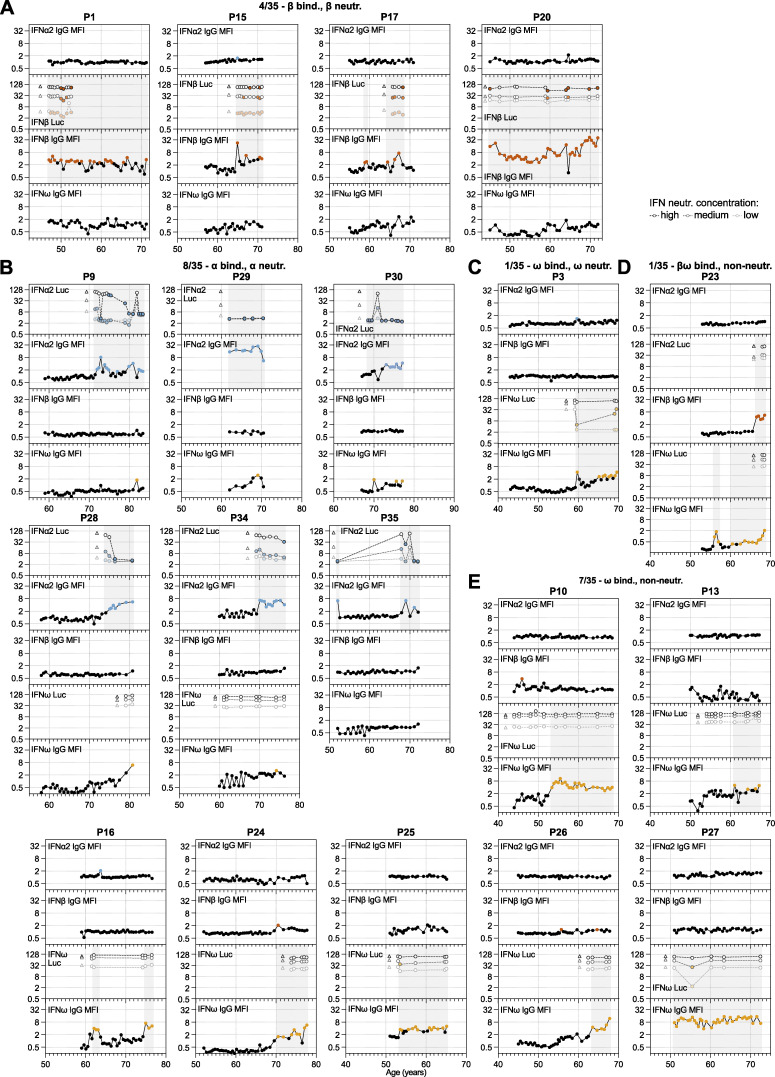
Figure S1.
High-resolution longitudinal analysis of anti-IFN-I autoAb development over decades. Continued from Fig. 2. (A–E) Patient-level representation of anti-IFNα2, anti-IFNβ, and anti-IFNω IgG levels (MFI FC), as well as IFNα2, IFNβ, or IFNω neutralization (inhibition of IFN-induced luciferase [Luc] activity) at three different doses (see Materials and methods) for all available longitudinal samples plotted as a function of patient age (years). Each sample was tested in duplicate, and selected samples were retested for independent experimental validation. Colored circles represent samples considered positive for either binding IgG or neutralization (see Materials and methods for thresholds). Triangles in neutralization plots represent negative controls. In all panels, individual patients are grouped according to the types of IFN-I to which they possess binding and neutralizing IgG (indicated at the top of each panel, together with the n/35 patients who have a similar phenotype).

