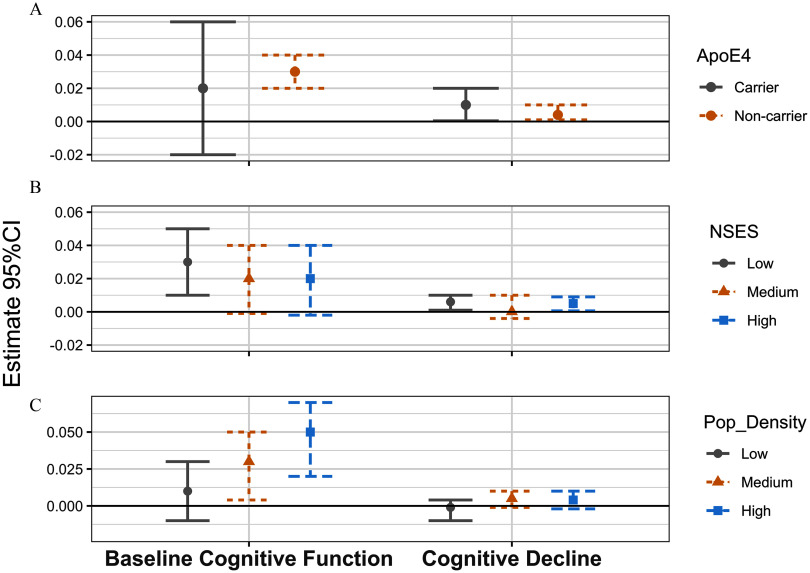
Figure 1.
Association of midlife exposure to residential greenness [normalized difference vegetation index (NDVI), 1986–1994] with baseline cognitive function and cognitive decline of global cognition (1995–2008), stratified by NSES, population density, and apolipoprotein E ɛ4 (apoE-ɛ4) carriers, the Nurses’ Health Study (). Linear mixed models were used, including an intercept that represents the mean cognitive level at baseline and a slope parameter that represents the mean annual rate of cognitive decline over time. Numeric data for effect estimates are shown in Table S13. Sample sizes were as follows: low NSES ; medium NSES ; high NSES ; low population density ; medium population density ; high population density ; ApoE-e4 noncarriers ; and ApoE-e4 carriers . Interaction -values for baseline cognitive function are as follows: ApoE4 , NSES , and population density . Interaction -values for cognitive decline are as follows: ApoE4 , NSES , and population density . Note: CI, confidence interval; NSES, neighborhood socioeconomic status; Pop_Density, population density.

