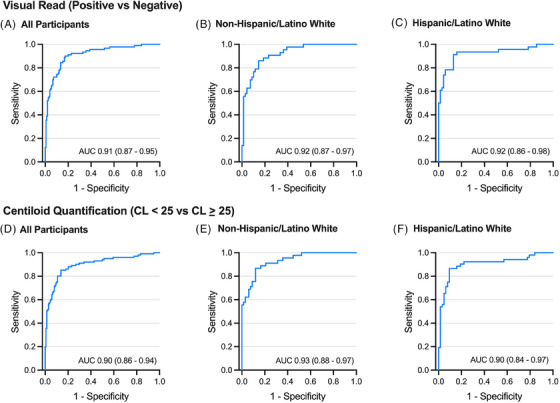
FIGURE 1.

Receiver operating characteristic (ROC) curves showing plasma p‐tau217 discriminability of positive versus negative amyloid‐beta positron emission tomography (Aβ‐PET) results based on different interpretation methods and thresholds. (A–C) Visual read interpretation of Aβ‐PET results for the overall sample (panel A, All Participants) and separately within non‐Hispanic/Latino white (B) and Hispanic/Latino white (C) groups. (D–F) Centiloids‐based quantification of positive versus negative Aβ‐PET based on a threshold of 25 Centiloids for the overall sample (D), within non‐Hispanic/Latino white (E), and within Hispanic/Latino white (F). Area under the curve (AUC) estimate with 95% confidence interval is shown for each. See Tables 2, 3, 4 for corresponding single‐ and two‐cutoff ranges of p‐tau217 concentrations.
