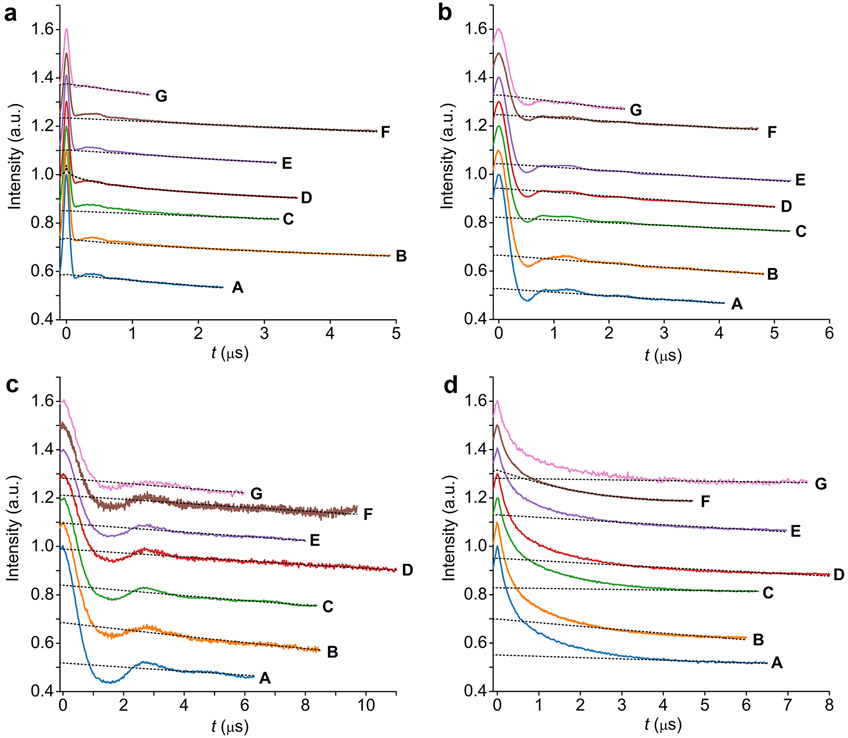
Figure 3.
Q-band PELDOR/DEER time traces. Time traces for (a) S585R1/Q603R1, (b) V599R1/N624R1, (c) Y588R1/N624R1, and (d) S353R1/Q635R1. The time traces are color-coded according to the laboratories A–G. The time traces are shifted relative to each other for better visibility. The background fits done in DeerAnalysis (Versions 2015–2019) are overlaid as gray dotted lines.

