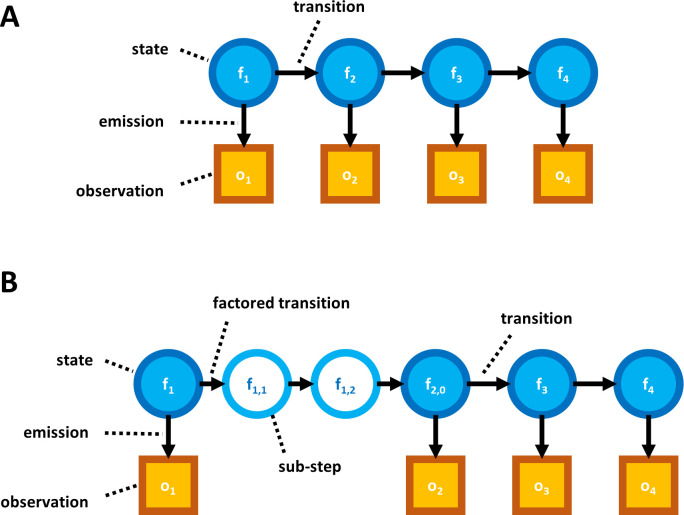
Fig 5. Illustration of HMM factorization.
(A) Diagram of a non-factored HMM model. Arrows represent a conditional probability relationship. The transitions between states determine how a state at one time step is probabilistically related to the state at the preceding time step. Emissions represent how the observable data is probabilistically determined by the associated state. (B) Diagram including a factored transition. Breaking a transition into a factored product of sub-transitions introduces “sub-steps”; though not accurate models of any physical states of an actual peptide, these sub-steps prove useful for algorithmic purposes.

