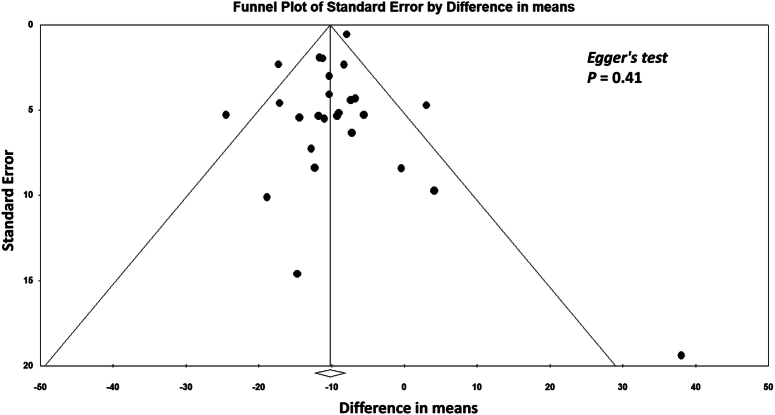
Figure 1.
Funnel plot assessing publication bias in the analysis of studies on the effect of EA on time to first flatus. Each point represents an individual study and is plotted according to the standard error and difference in means. The vertical line indicates the pooled estimate of the difference in means, whereas the diagonal lines represent the expected distribution of studies in the absence of publication bias. Egger’s test (P = 0.41) suggests no significant evidence of publication bias in this meta-analysis. EA, electroacupuncture.

