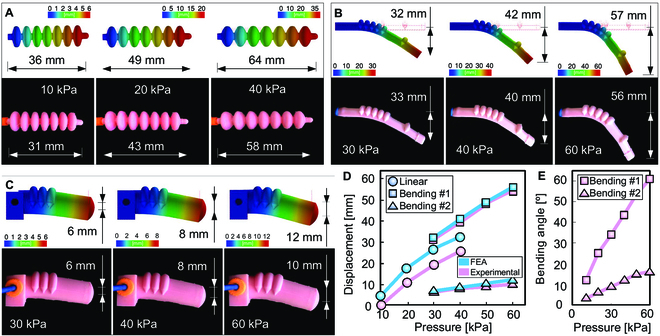
Fig. 3.

Numerical predictions versus experimental measurements. (A) Elongation of the linear actuator for different values of input pressures. (B) Radial deflection of the actuator bending #1 (vertical displacement) for different values of input pressure. (C) Radial deflection of the actuator bending #2 (vertical displacement) for different values of input pressure. (D) Maximum displacement reached by the actuators for different pressure values. The blue curve represents the numerical results, whereas the pink curve represents the experimental ones. (E) The experimental bending angles of the actuators’ bending #1 and bending #2 for different pressure values.
