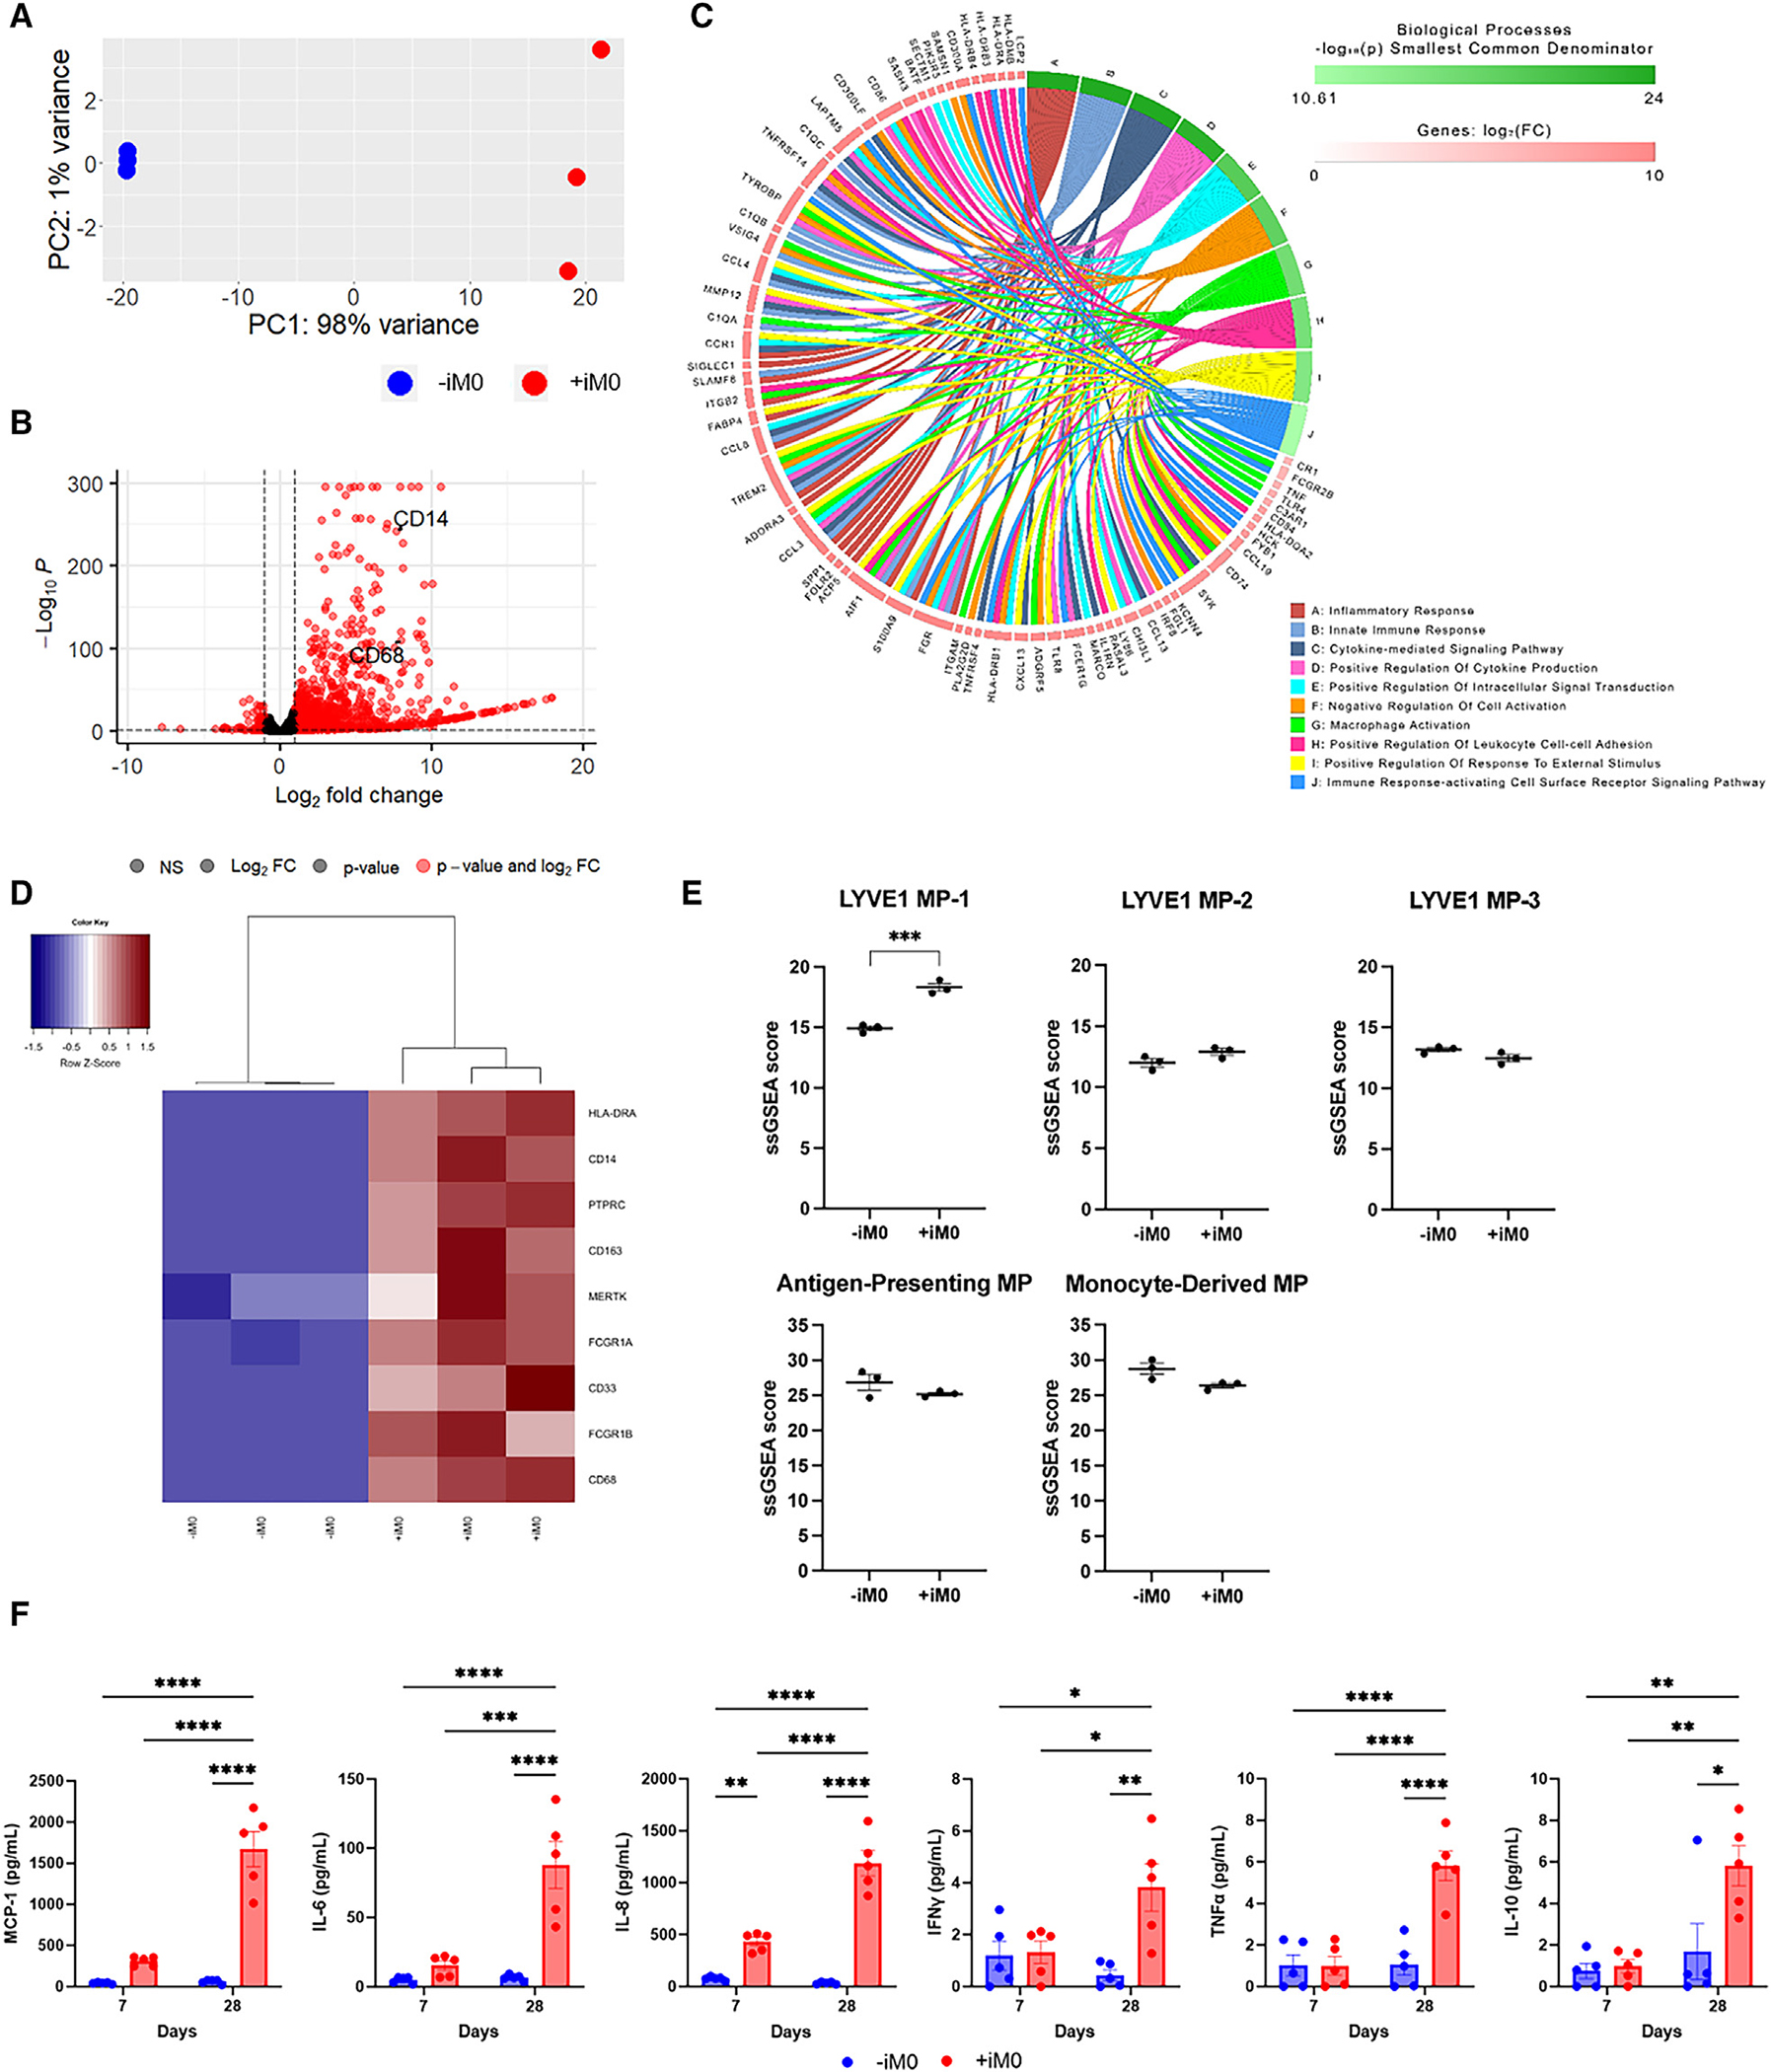
Figure 2. RNA-seq confirms iM0 presence within cardiac tissues after 4 weeks.

(A) Principal-component analysis of gene count data for hECTs prepared with (+iM0) and without (−iM0) macrophages.
(B) Enhanced volcano plot of differentially expressed genes, determined by p < 0.01, log2(fold change) > 1, including markers indicative of macrophage presence in CD14 and CD68.
(C) Chord diagram of the top 10 biological processes and corresponding differentially expressed genes generated by AdvaitaBio iPathwayGuide.
(D) Hierarchical clustering of gene counts for a panel of markers indicative of CCR2-HLA-DR+ tissue-resident macrophages in +iM0 and −iM0 tissues.
(E) Single-sample gene set enrichment analysis for gene sets describing macrophage populations found within the adult human heart. Analysis was not restricted to only differentially expressed genes. Data were analyzed via two-tailed t test.
(F) Production by +iM0 and −iM0 hECTs of inflammatory cytokines in tissue supernatant after 7 and 28 days.
Statistical significance was determined by two-way ANOVA with Tukey’s post hoc analysis; *p < 0.05, **p < 0.01, ***p < 0.001, and ****p < 0.0001. Data represent mean ± SEM.
