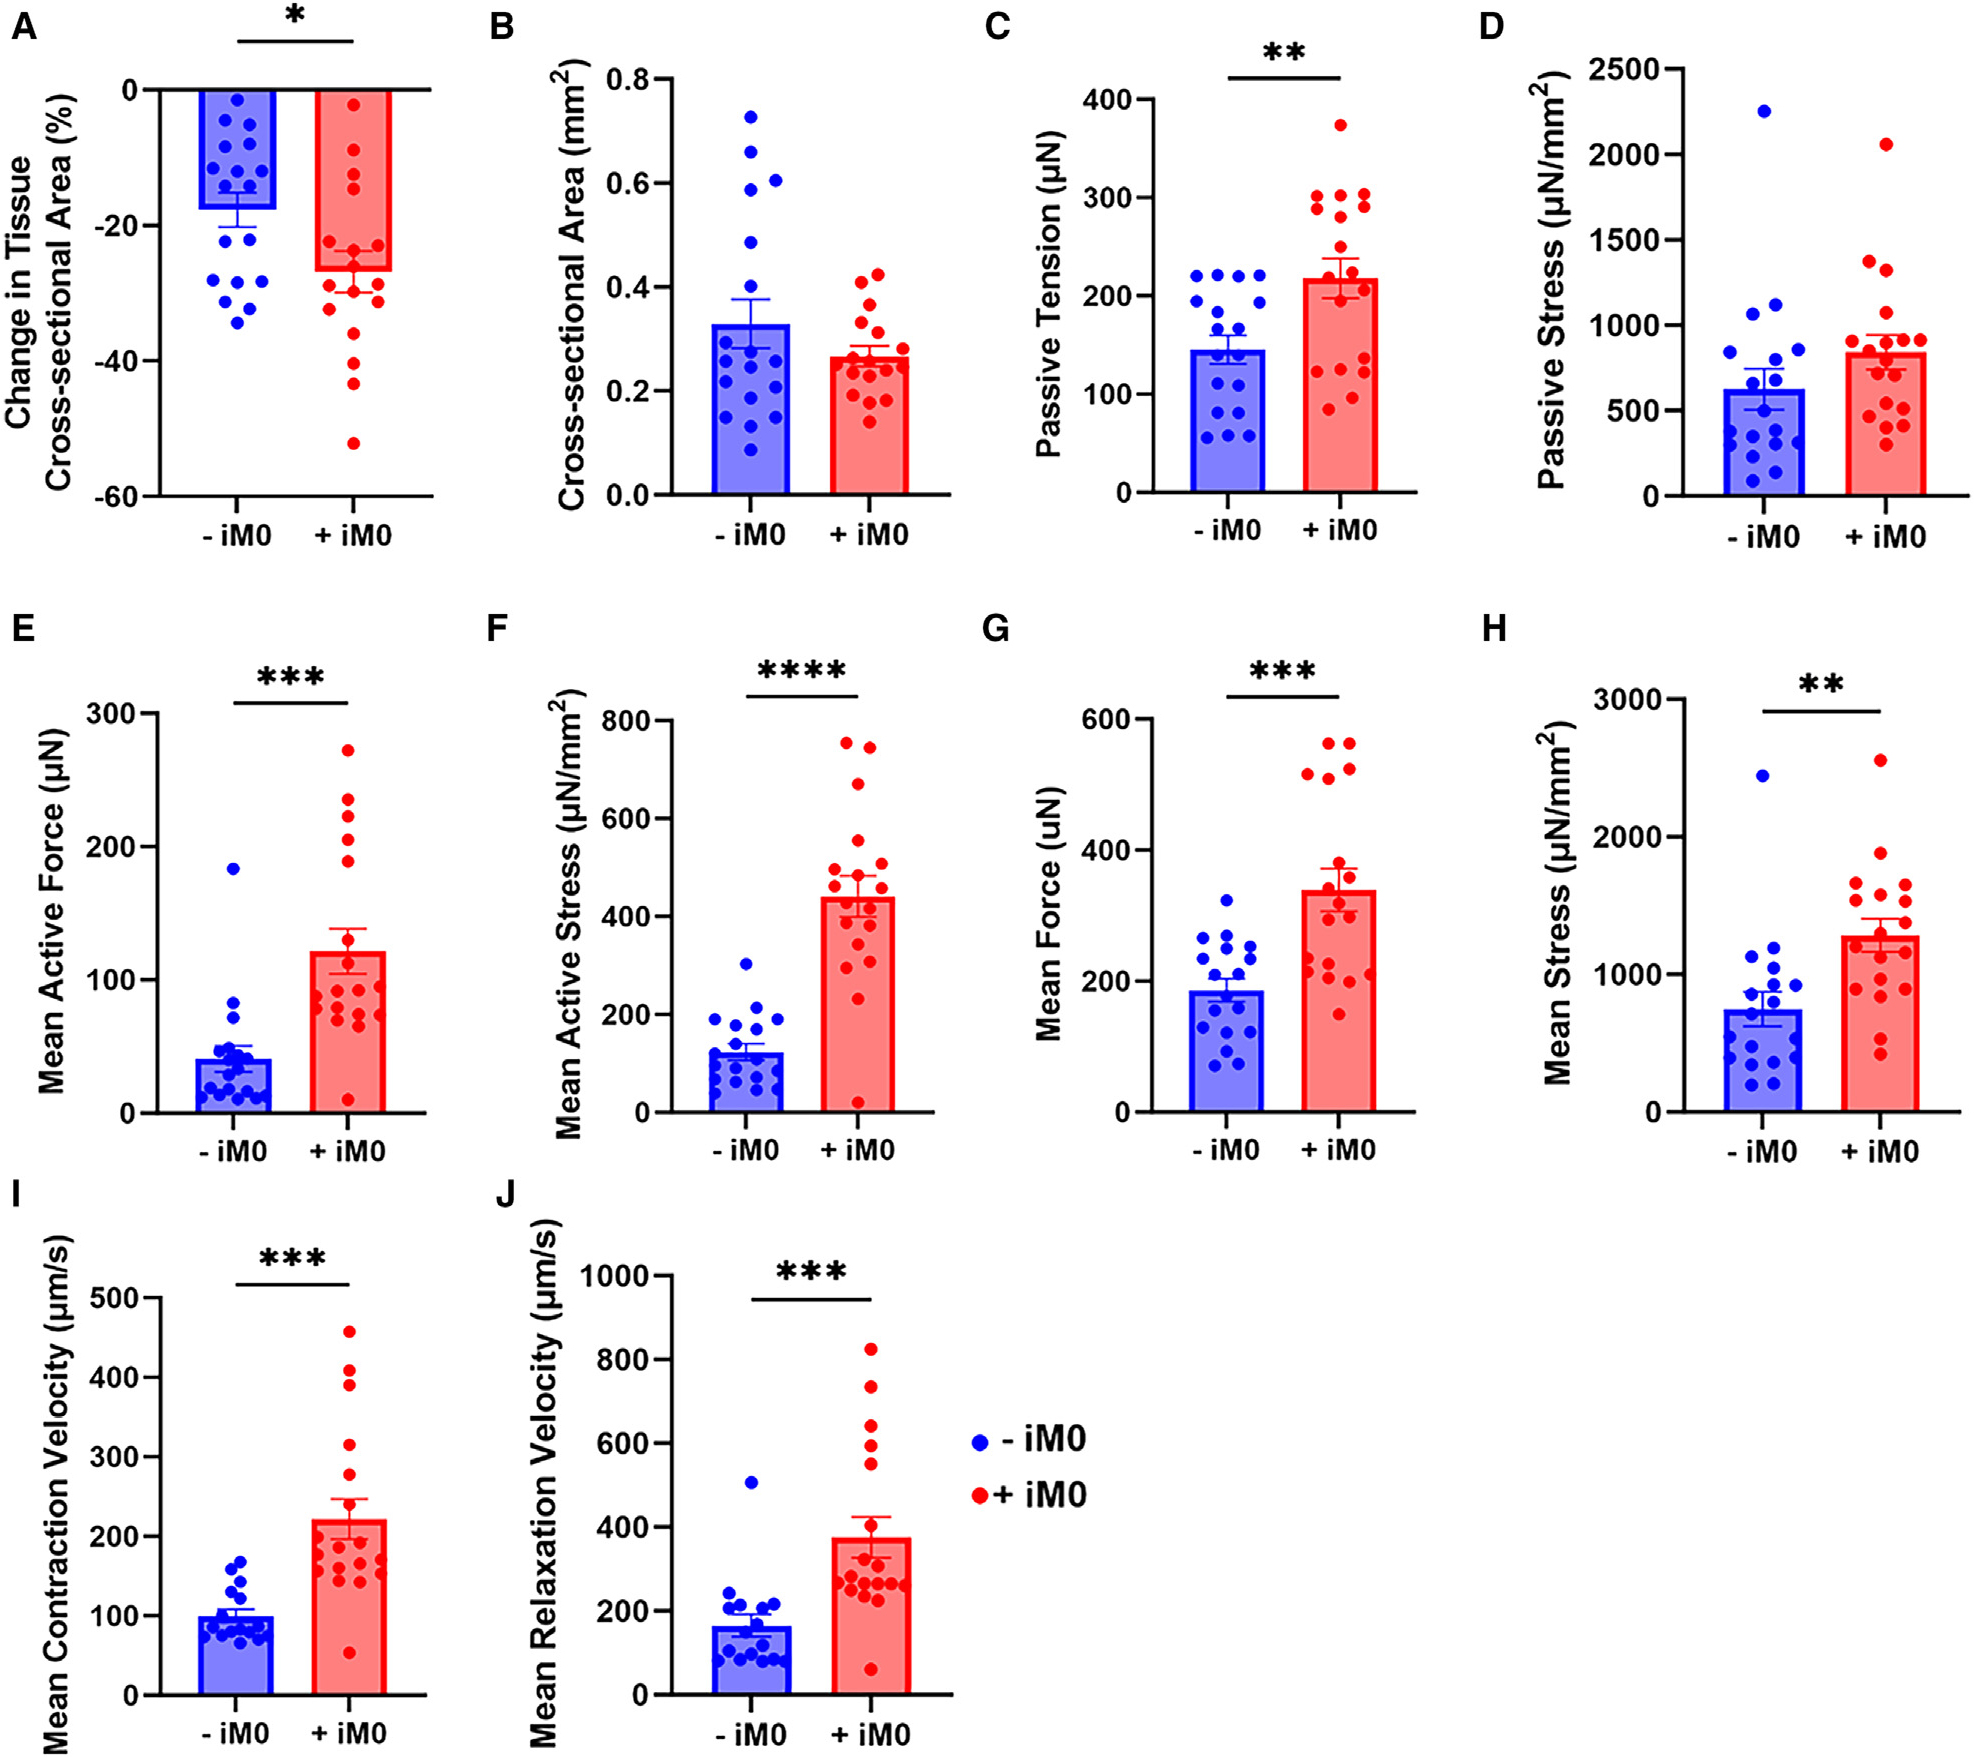
Figure 3. iM0s alter cardiac tissue function.

(A and B) Quantification of (A) tissue compaction and (B) tissue cross-sectional area at 28 days.
(C–J) Quantification of metrics of contractile function at 1 Hz stimulation including (C) passive tension, (D) passive stress, (E) mean active force, (F) mean active stress, (G) mean force, (H) mean stress, (I) mean contraction velocity, and (J) mean relaxation velocity.
Data represent mean ± SEM and were assessed via two-tailed t test; *p < 0.05, **p < 0.01, ***p < 0.001, and ****p < 0.0001.
