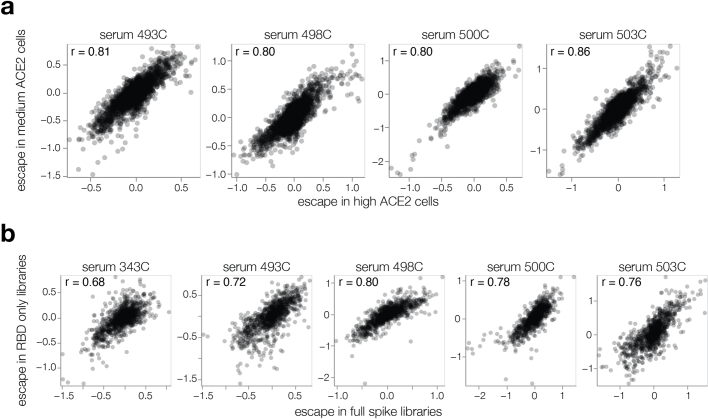
Extended Data Fig. 5. Correlation among serum escape mapping experiments.
a, Correlation between mutation escape scores for experiments using the full-spike XBB.1.5 libraries performed on 293 T cells expressing high or medium amounts of ACE2 for four sera. Note that the medium cells were used for all other figures shown in this paper. b, Correlation between mutation escape scores for mutations in the XBB.1.5 full spike and RBD-only libraries. See https://dms-vep.github.io/SARS-CoV-2_XBB.1.5_spike_DMS/htmls/compare_high_medium_ace2_escape.html and https://dms-vep.github.io/SARS-CoV-2_XBB.1.5_spike_DMS/htmls/compare_spike_rbd_escape.html for interactive versions of these scatter plots that also show line plots of per-site escape values for each serum.

