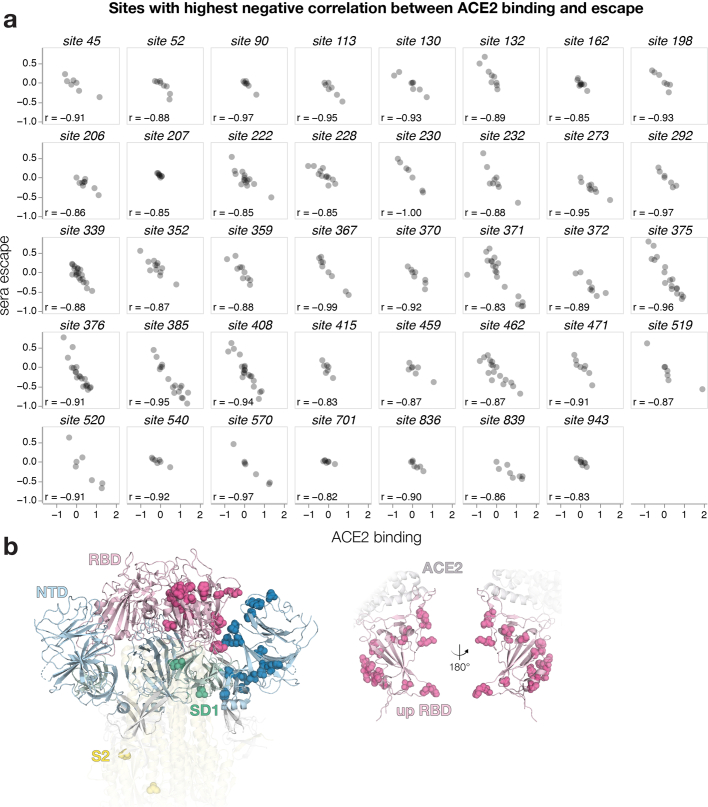
Extended Data Fig. 9. Sites with highest inverse correlation between ACE2 binding and serum escape.
a, Correlation between ACE2 binding and serum escape for sites in XBB.1.5 spike. Only sites with at least 7 mutations measured and Pearson r < 0.82 are shown. b, Most sites with strongly negative correlations between mutational effects on ACE2 binding and escape are at positions that could plausibly impact the RBD conformation in the context of the full spike, since they tend to be at the interface of the RBD and other spike domains. Left: all sites from a shown on spike structure as spheres. RBD is colored in light pink, NTD light blue, SD1 green and the S2 subunit in yellow. Spheres are shown on only one chain for each domain for clarity (PDB ID: 8IOU). Right: RBD sites from a shown on RBD in up position engaged with ACE2. RBD is colored in light pink and ACE2 is gray.

