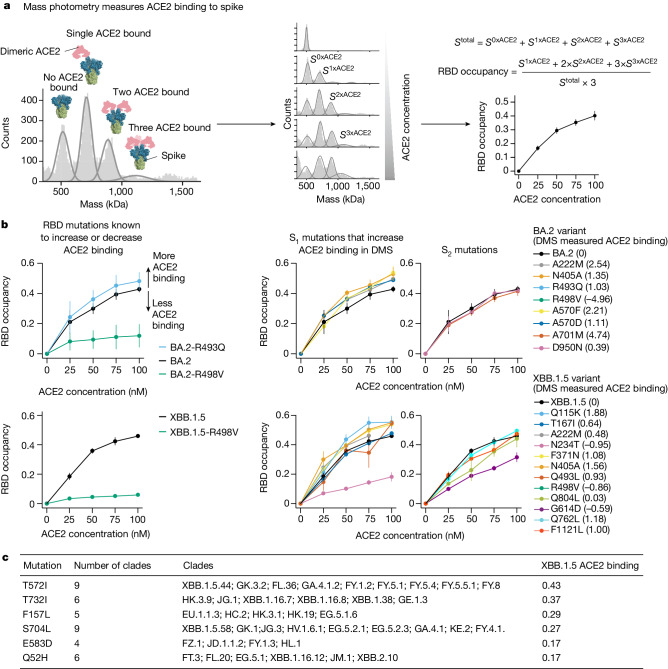
Fig. 3. Non-RBD mutations affect ACE2 binding.
a, ACE2 binding measurements using mass photometry. The histogram on the left shows distribution of spike molecular mass when no (S0xACE2), one (S1xACE2), two (S2xACE2) or three (S3xACE2) ACE2 molecules are bound. We measure how this mass distribution changes as spike is incubated with increasing concentrations of soluble dimeric ACE2. RBD occupancy is the fraction of RBDs bound to ACE2, calculated using Gaussian components for S0xACE, S1xACE2, S2xACE2 and S3xACE2 at each ACE2 concentration. b, RBD occupancy measured using mass photometry for different BA.2 and XBB.1.5 spike variants. Top left panel shows that a BA.2 spike mutation known to increase ACE2 binding (R493Q/blue) has greater RBD occupancy relative to unmutated BA.2 (black) spike, by contrast a mutation known to decrease ACE2 binding (R498V/green) has lower RBD occupancy in both BA.2 (top left panel) and XBB.1.5 (bottom left panel) backgrounds. Panels on the right show RBD occupancy for BA.2 (top right) and XBB.1.5 (bottom right) spike variants with mutations in S1 or S2 subunits measured to increase ACE2 binding in the deep mutational scanning. Values shown in parentheses after the mutation in the legend are the effect on ACE2 binding measured by deep mutational scanning. Error bars in plots a and b indicate standard error between two replicates. c, Non-RBD mutations measured to increase ACE2 binding in deep mutational scanning experiments that have arisen independently as defining mutations in at least four XBB-descended clades.

