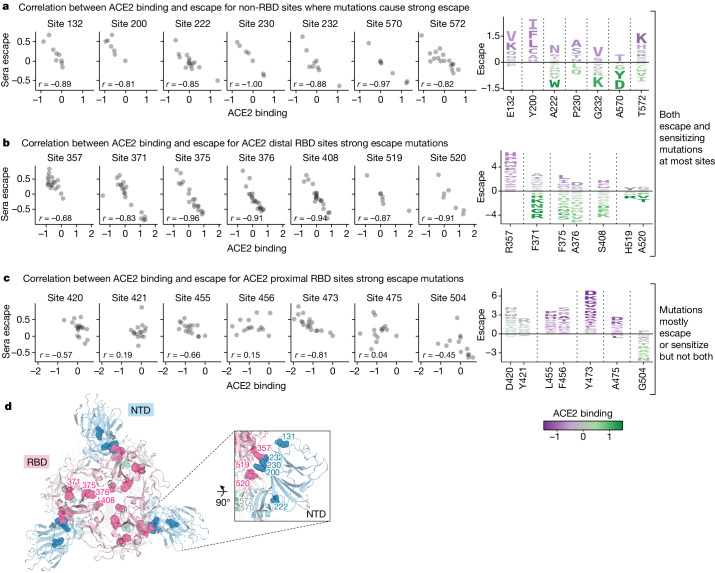
Fig. 5. Sera escape and ACE2 binding are inversely correlated for non-RBD and ACE2-distal RBD sites.
a, The left shows a correlation between ACE2 binding and sera escape for amino-acid mutations at non-RBD sites with the highest mutation-level sera escape (each point is a distinct amino-acid mutation). Average escape for each mutation across all sera is shown. The right shows a logo plot for the same sites, with letter heights proportional to escape caused by that mutation (negative heights mean more neutralization), and letter colours indicating effect on ACE2 binding (green means better binding). b, A similar plot for RBD sites that are distal (at least 15 Å) from ACE2. c, A similar plot for RBD sites proximal (within 15 Å) to ACE2. Only sites with at least seven different mutations measured are included in the logo plots. d, Top-down view of XBB spike (Protein Data Bank ID 8IOT) with the non-RBD and ACE2-distal sites shown in a and b highlighted as spheres. The RBD is pink, the NTD is blue and sites in SD1 are green.

